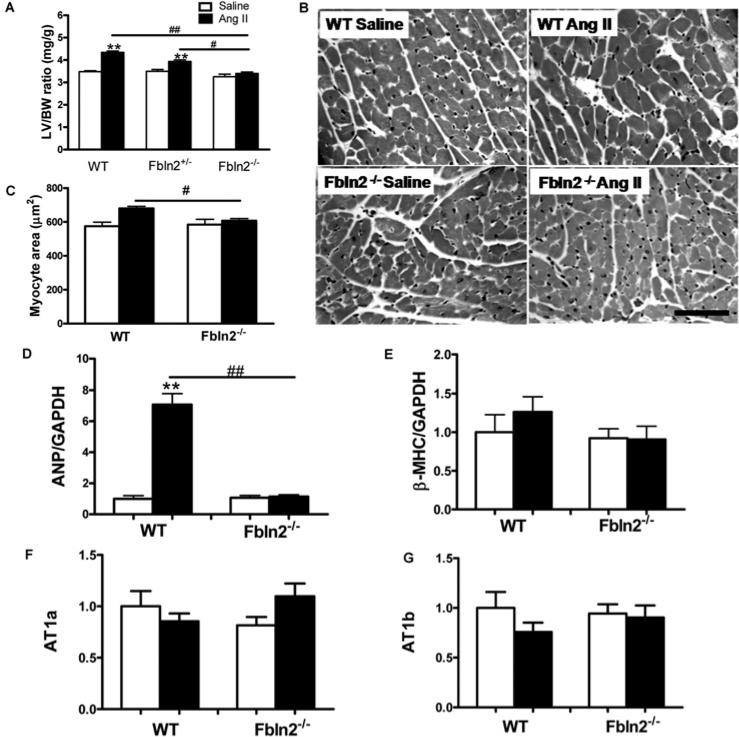
Figure 2. Myocardial hypertrophy induced by continuous subpressor AngII infusion.
(A) LVW/BW ratio of saline and AngII-treated WT, Fbln2+/− and Fbln2−/− mice. #P < 0.05 and ##P < 0.01. **P < 0.01 compared with corresponding saline group (n = 10). (B) Microscopic images (H&E staining) of LV myocardium after 4 weeks of treatment with saline and AngII in WT and Fbln2−/− mice. Note the increased myocyte cross-sectional area in AngII-treated WT myocardium. (C) Cardiomyocyte cross-sectional area of 4-week saline and AngII-infused WT and Fbln-2−/− hearts. Measured cross-sectional area of myocytes was significantly increased in AngII-treated WT, whereas there was no increase in Fbln2−/− by AngII treatment (n = 3). (D) and (E) ANP and β-MHC mRNA levels by qRT–PCR. WT (saline, n = 10; AngII, n = 15) and Fbln2−/− (saline, n = 10; AngII, n = 15). (F) and (G) AT1a and AT1b. WT (saline, n 5; AngII: n = 5) and Fbln2−/− (saline: n 5, AngII: n = 5). The mRNA levels of WT-saline were arbitrarily set at 1. #P < 0.05 ## and P < 0.01. **P < 0.01 compared with corresponding saline-treated group.

