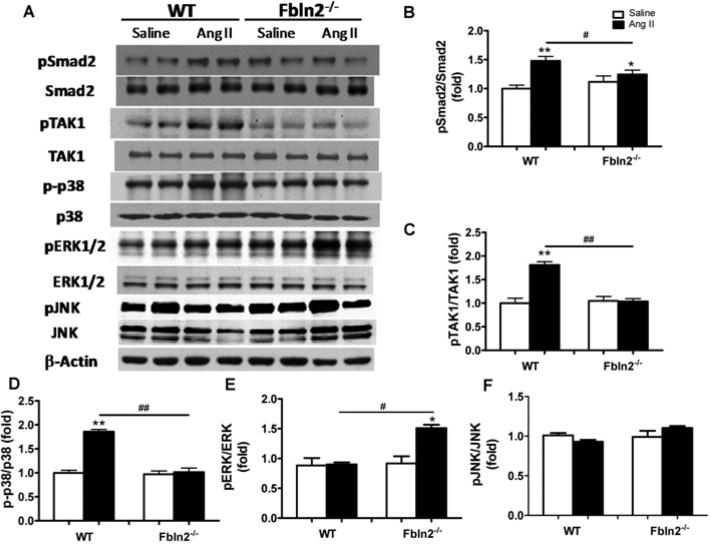
Figure 5. Assessment of TGF-β downstream signalling pathways by Western blot analyses.
Activity levels of each signalling protein are indicated by the ratio of phosphorylated form/total form. (A) Representative Western blots of Smad2, TAK1, p38 MAPK, ERK1/2 and JNK with each corresponding phosphorylated form. Smad2 (B), TAK1 (C) and p38 MAPK (D) were all significantly up-regulated in AngII-treated WT mice, whereas no significant AngII-induced increase was seen in Fbln2−/− . On the contrary, ERK1/2 (E) showed significant increase only in Fbln2−/− but not in WT. JNK (F) did not change with AngII either in WT or Fbln2−/− . The ratio in saline-treated WT is arbitrarily set at 1. Sample size: n = 6 from each group for Smad2, TAK1 and p38 MAPK, and n = 4 for ERK1/2 and JNK. #P < 0.05 and ##P < 0.01. *P < 0.05 and **P < 0.01 compared with the corresponding saline-treated groups.

