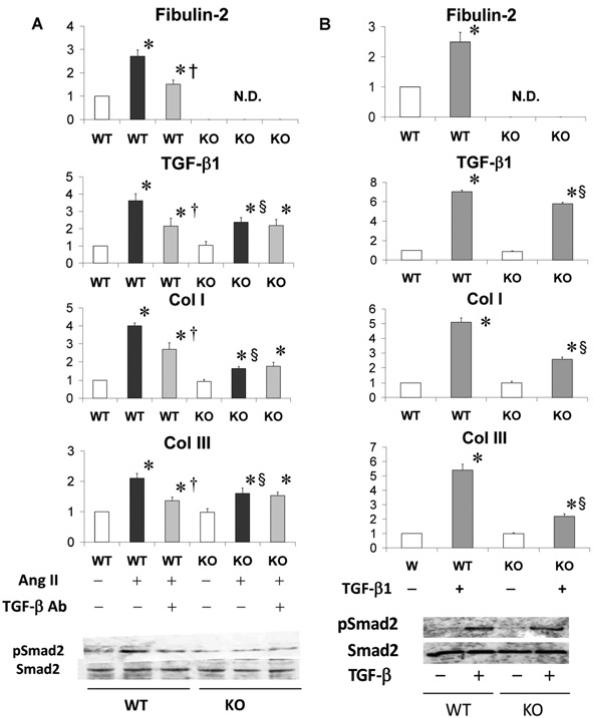
Figure 7. Isolated CFs from WT and KO (Fbln2−/−) mice treated with AngII + TGF-β nAb (A) and recombinant TGF-β (B).
Upper histograms indicate mRNA levels of fibulin-2, TGF-β1, Col I and Col III. The mRNA levels of WT controls were arbitrarily set at 1. Note that there were no effects by TGF-β nAb in AngII-treated KO cells, suggesting that KO cells did not show TGF-β-mediated effects when stimulated with AngII (A). Shown below are pSmad2 and Smad2 expression by Western blots. In KO cells, pSmad2 showed no change with either AngII or AngII + TGF-β nAb. *P < 0.05 compared with sham (white bar), P§ < 0.05 compared with WT, and †P < 0.05 compared with AngII-treated group (black bar).

