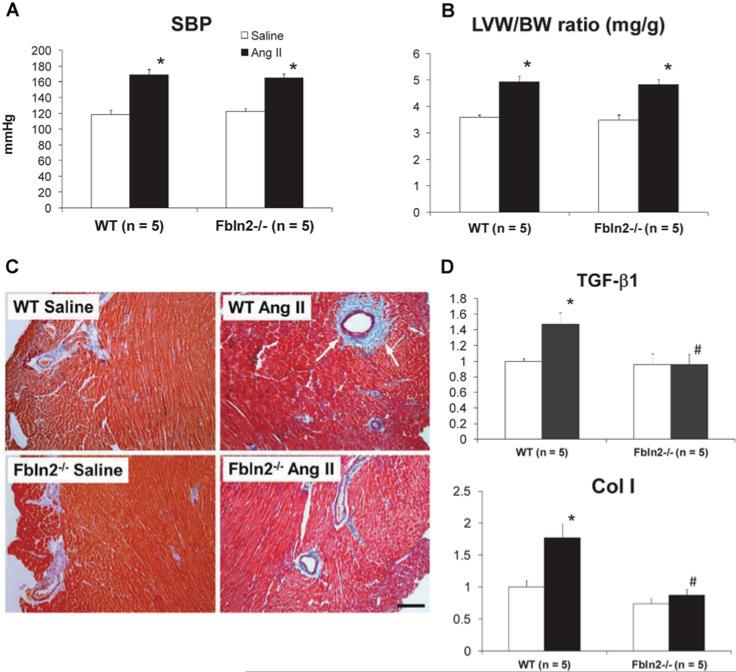
Figure 8. Pressor dosage of AngII infusion (2.0 μg/kg of BW per min) induced a comparable degree of hypertension in both WT and Fbln2−/−.
After 4 weeks of AngII treatment, both groups developed equal degrees of hypertension (A) and hypertrophy shown by LVW/BW (B). (C) Masson's Trichrome staining of LV myocardium. The development of fibrosis was significantly attenuated in Fbln2−/− compared with WT. See marked perivascular fibrosis in WT AngII (see arrows). Scale bar, 100 μm. (D) The mRNA levels of TGF-β1 and Col I were significantly increased in WT by pressor dose of AngII infusion, whereas no noticeable increase was seen in Fbln2−/− . *P < 0.05 compared with saline group, #P < 0.05 compared with WT. Results are means± S.E.M.

