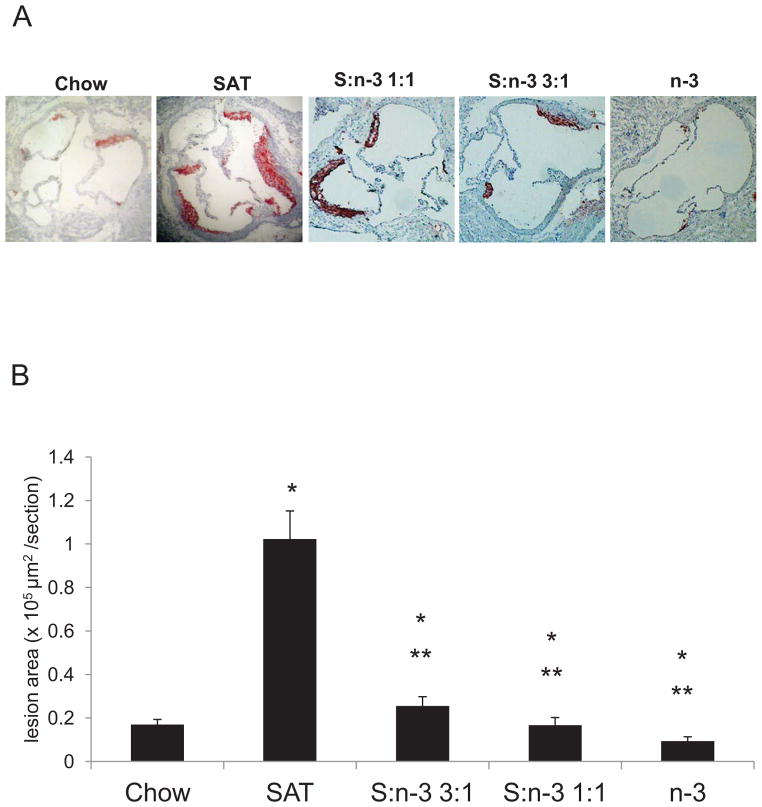
Figure 4.
Atherosclerotic lesion development in LDLR−/− mice after feeding with different diets. At the end of each feeding period, aorta of LDLR−/− mice were collected as described in Methods. Representative images of the aortic origin stained with hematoxylin and Oil-Red-O (A). (B) Quantitation of atherosclerosis in the aortic origin in LDLR−/− mice (n=8–10 for each group). The results are expressed as mean lesion area (μm2) ±SE. *, vs. chow; **, S:n-3 3:1/1:1/n-3 vs. SAT, p<0.01.

