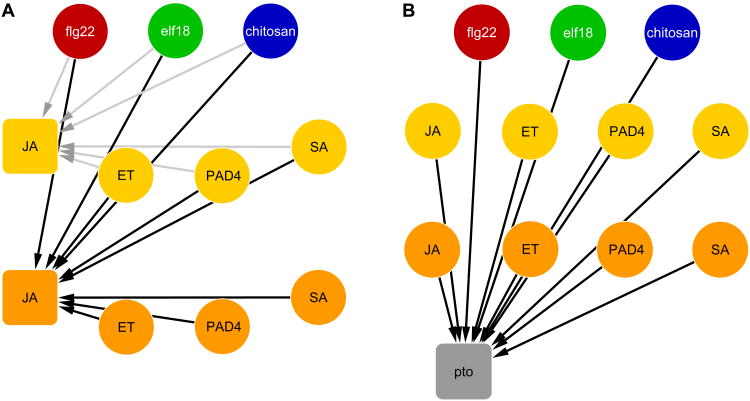
Figure 1.
Starting network structures of regression models for (A) the JA sector and (B) the immunity against Pto as examples. Our model consists of four layers, listed from the top: (1) three MAMP treatment inputs (flg22 (red), elf18 (green), and chitosan (blue)); (2) activities of four signaling sectors at 3 hpt (yellow nodes); (3) activities of the signaling sectors at 9 hpt (orange nodes); and (4) two immunity outputs (against Pto and Pma strains, pto gray node shown). Each link represents a directional dependency between an explanatory variable “source” node and a response “target” node. Gray and black links in (A) represent the models for 3 and 9 hpt, respectively. See also Figure S1.

