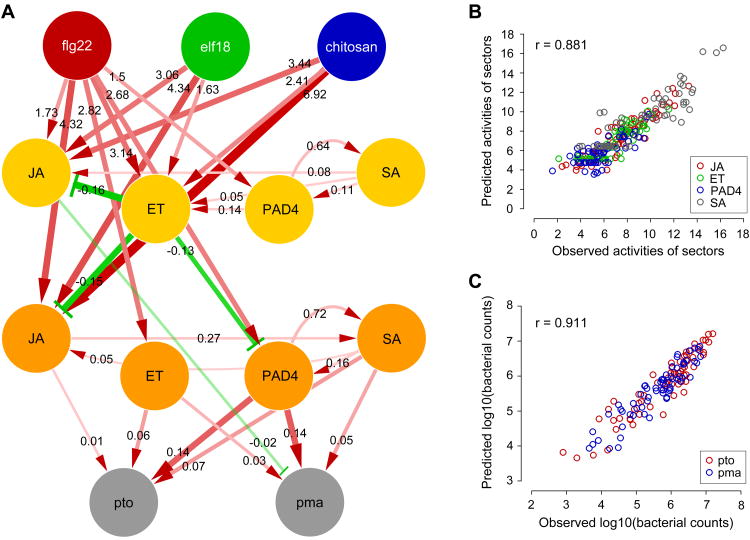
Figure 2.
The PTI signaling network model has a high level of predictive power. (A) The obtained model. Directional links in red and green represent the significant parameters, indicating activation and inhibition, respectively. The width and color intensity of the links represent parameter values. The links to the immunity nodes are scaled differently from those to the sector nodes for better visualization. The links from the MAMP nodes to the immunity nodes are not shown as they represent the immunity level that is not explained by the four sectors. The estimated mean parameter value for each link is indicated. (B and C) The model predictions vs. the observed data of the sector activities across the treatment:genotoype:time:sector combinations (B) and the immunity level across the treatment:genotype:strain combinations (C). The associated Pearson correlation coefficients are shown as r. Red circle, JA; green, ET; blue, PAD4; gray, SA in (B) and red, Pto; blue, Pma in (C). See also Figures S1F, S2, and S3 and Table S1.

