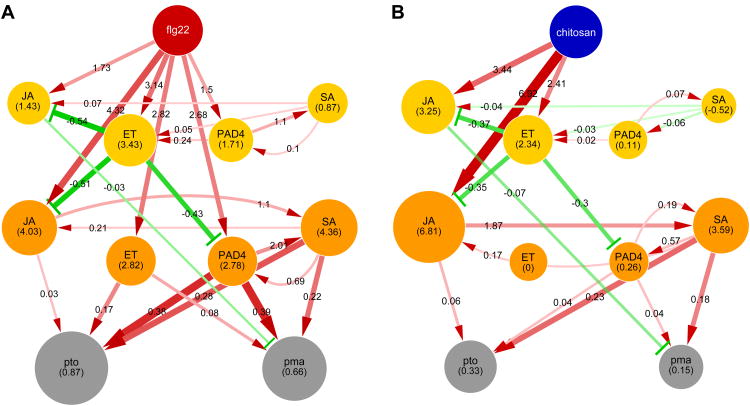
Figure 5.
Treatments of wild type with flg22 (A) and chitosan (B) have different signal input patterns, which results in distinct network responses. These “network activity maps” make visual the model-predicted relative sector activity and immunity level by the respective node sizes, and the relative amount of signal flow by the width and color intensity of the link. Link values were calculated relative to mock treatment for each MAMP treatment. The range of immunity levels was scaled from 0 to 1, and the links targeting the immunity nodes were scaled according to the scaled immunity level. The predicted relative sector activity and the relative signal flow values are indicated in the node and along the link, respectively. Otherwise, the representation is the same as the model with parameter values in Figure 2A. See also Figure S5.

