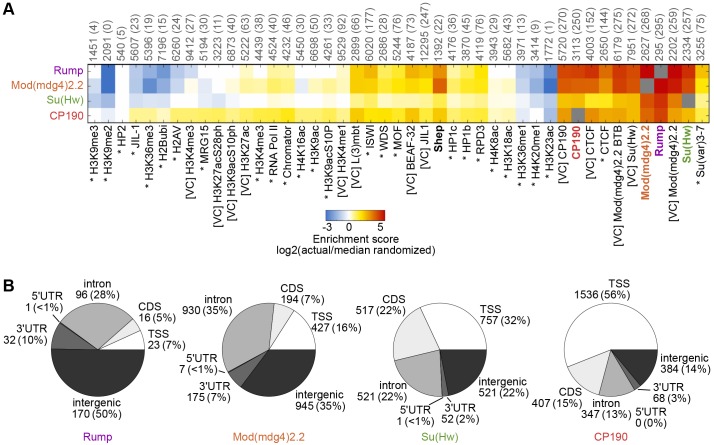
Fig. 7.
Comparison of Rump chromatin association to other factors and gene features. (A) Heat map of log2 enrichment scores for pairwise comparisons of binding sites for Rump, Mod(mdg4)2.2, Su(Hw) and CP190 with additional data sets. The color scale corresponding to the enrichment value is indicated (bottom). Positive values indicate significant enrichment, whereas negative values indicate significant negative correlation of enrichment. Self–self comparisons are indicated in gray, and pairwise comparisons that are not statistically significant (P>0.001) are indicated in white. The numbers along top of each column indicate the total number of euchromatic features in each data set, and the number of sites overlapping with Rump are indicated in parentheses. Data from modENCODE (Kharchenko et al., 2011) are indicated by an asterisk, data from other studies (Kellner et al., 2012; Van Bortle et al., 2012; Wood et al., 2011) are indicated by [VC] and those generated in this study are in bold. The full heat map with hierarchical clustering is shown in supplementary material Fig. S4. (B) Classification of Rump, Mod(mdg4)2.2, Su(Hw) and CP190 binding sites. The number of sites and the percentage of the total (shown in parentheses) corresponding to TSS, transcription start site; CDS, coding sequence; 5′ UTR, 5′ untranslated region; 3′ UTR, 3′ untranslated region. See Materials and Methods for the hierarchy of overlapping categories.

