Fig. 1.
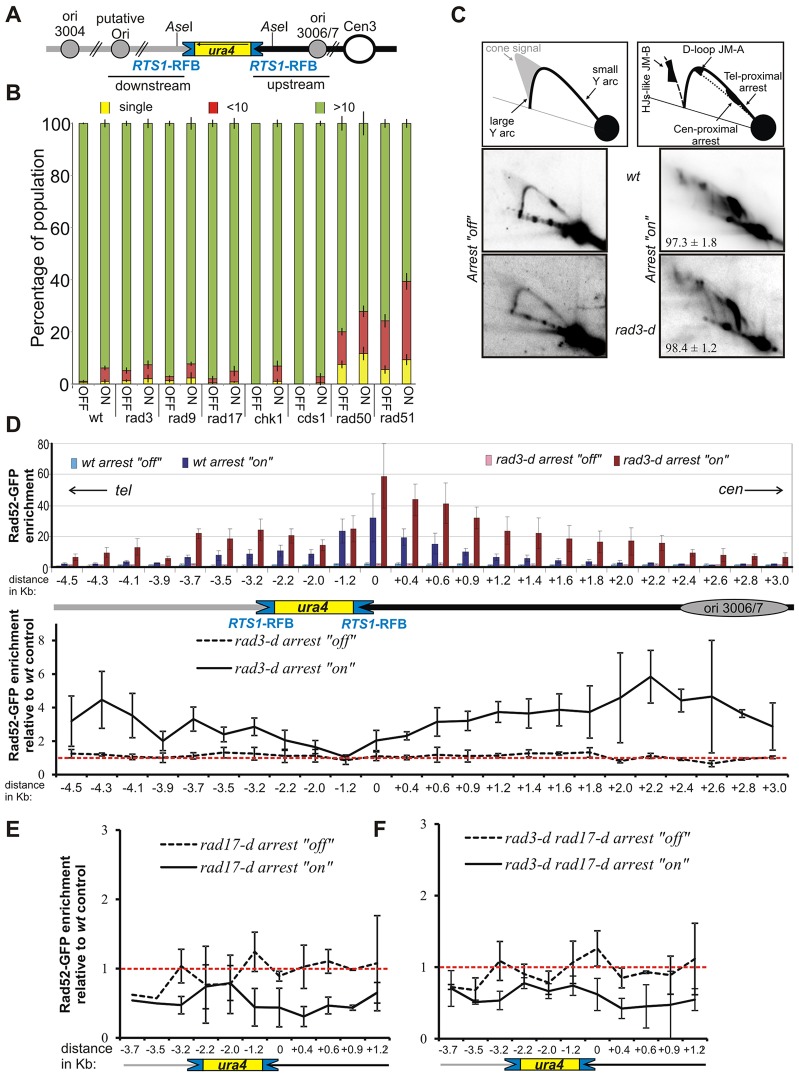
The checkpoint proteins Rad3ATR and Rad17 regulate the recruitment of Rad52 to the RuraR locus. (A) Schematic representation of the RuraR locus. Grey and black lines, telomere- and centromere-proximal sides of the ura4 gene, respectively; blue boxes, RTS1-RFB sequences and their polarity; black arrow indicates the orientation of the ura4 gene. The nearest replication origin (ori3006/7, grey circles) is located 5 kb cen-proximal to RuraR. AseI sites are ∼1 kb cen-proximal and 0.6 kb tel-proximal from RTS1. (B) Checkpoint pathways do not affect viability in the RuraR system. RuraR cells with the indicated genetic backgrounds were grown for 24 hours either with or without thiamine (replication arrest ‘off’ and ‘on’, respectively) and plated onto YE agar plates. The percentage of single cells (unable to divide), micro-colonies of <10 cells (unable to sustain division) and colonies with >10 cells was estimated after 18 hours. The wild-type (wt) control strain contains the native ura4 locus with no flanking RTS1 sequences. (C) Lower panels, analysis of replication intermediates by 2DGE of DNA from the indicated strains grown for 24 hours in medium containing or lacking thiamine (fork arrest ‘off’ and ‘on’, respectively). Numbers indicate the percentage of forks arrested by the RTS1-RFB (±s.d.). Upper panels, diagrams of replication intermediates within the AseI restriction fragment analysed by 2DGE under the indicated conditions. HJ, Holliday junction; JM-A, joint-molecule A, corresponding to a D-loop intermediate (Lambert et al., 2010); JM-B, joint-molecule B corresponding to recombination intermediates containing HJs (Lambert et al., 2010). (D) Regulation of Rad52 recruitment to RuraR. Chromatin immunoprecipitation (ChIP) of Rad52–GFP followed by quantitative PCR (qPCR) was performed on the indicated RuraR rad52-GFP strains after 40 hours of growth either with or without thiamine (arrest ‘off’ and ‘on’, respectively). Cells containing the RuraR locus in a checkpoint-proficient (wt) background were analysed, alongside an isogenic strain harbouring the rad3-d alleles. The schematic is as described for A. Upper panel, data show the mean±s.e.m. (three independent experiments). Lower panel, enrichment in the rad3-d strain relative to the wild-type strain. Data show the mean±95% confidence intervals (CI) (three independent experiments). When the errors bars do not overlap the red dotted line (relative enrichment of 1), the level of Rad52 enrichment observed in the rad3-d strain is significantly different from the that of the wild-type strain (P<0.05). Numbers indicate the distance (kb) from the RTS1-RFB on the telomere (−) and centromere-proximal (+) sides, with the closest RFB to ori3006/7 being used as referential (0). (E,F) Rad52–GFP enrichment in the rad17-d strain (E) and the double mutant rad3-d rad17-d (F) relative to the wild-type strain, as described for D. Data show the mean±95% CI (two to three independent experiments).

