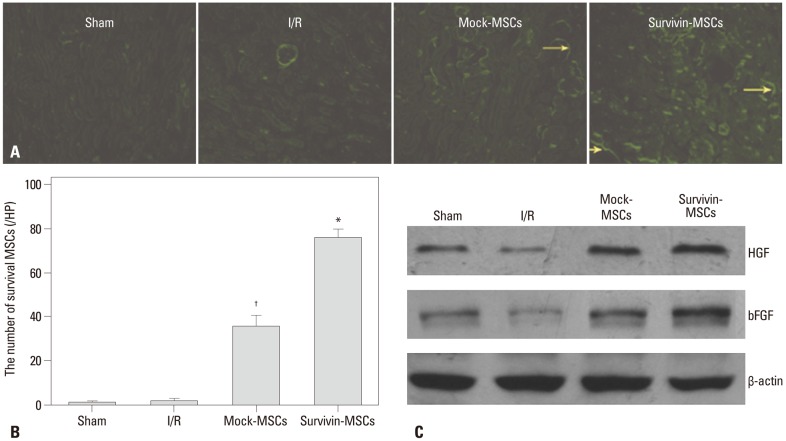
Fig. 5.
Survival of transplanted MSCs and HGF and bFGF expression in kidney tissue. (A) Kidney tissue specimens were collected to observe EGFP expression in renal slices by fluorescence microscope. EGFP-positive cells (yellow arrows). (B) Quantitative analysis of the number of survival MSCs at 7 days after transplantation. Data are presented as the mean±SD. *p<0.05, compared with control group. †p<0.05, compared with control group. (C) Kidney tissues were collected and lysed. Tissue lysates were prepared and subjected to western blot. Specific antibodies were used to detect HGF and bFGF. β-actin was used as a loading control. MSC, mesenchymal stem cell; HGF, hepatocyte growth factor; bFGF, basic fibroblast growth factor; EGFP, enhanced green fluorescent protein; I/R, ischemia-reperfusion.

