
Table 3.
Neointimal Types on Optical Coherence Tomography, Grouped by Clinical Presentations at Follow-Up
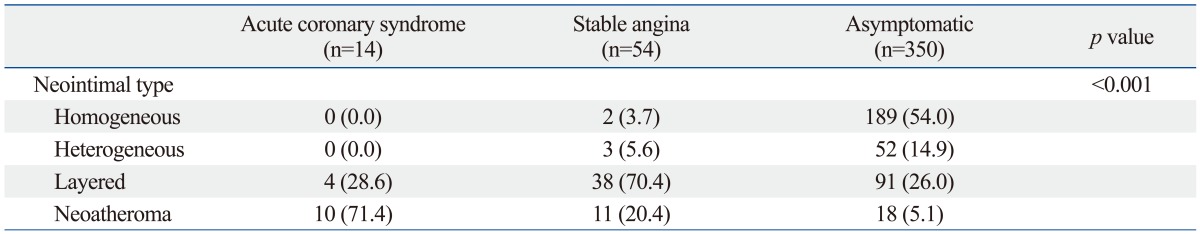
Data are presented as n (%).
Official websites use .gov
A
.gov website belongs to an official
government organization in the United States.
Secure .gov websites use HTTPS
A lock (
) or https:// means you've safely
connected to the .gov website. Share sensitive
information only on official, secure websites.
Neointimal Types on Optical Coherence Tomography, Grouped by Clinical Presentations at Follow-Up
Data are presented as n (%).