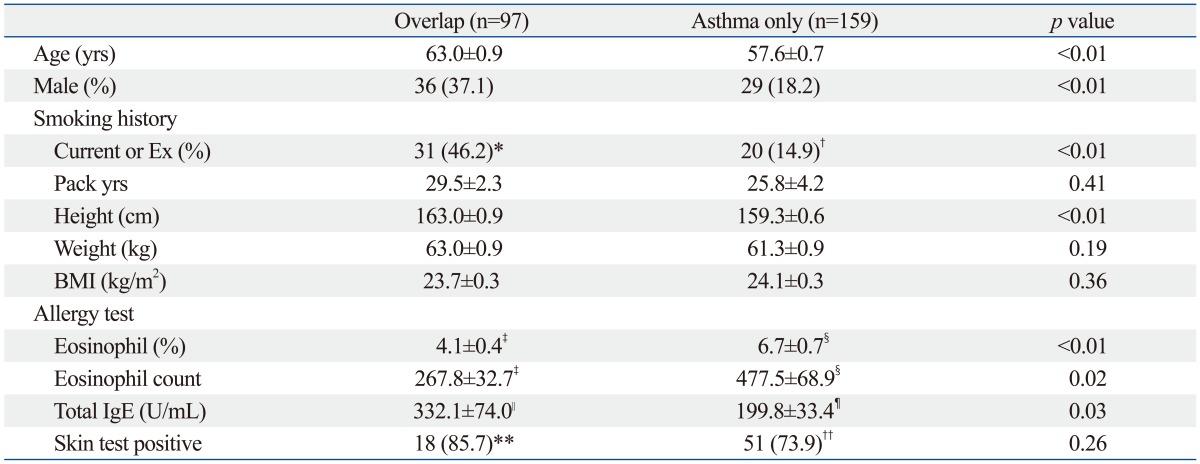
Table 1.
Comparison between Overlap and Asthma Only Group

BMI, body mass index; SEM, standard error of mean.
Values are mean±SEM or number of patients (%).
*n=67.
†n=134.
‡n=42.
§n=98.
∥n=22.
¶n=55.
**n=21.
††n=69.
Comparison between Overlap and Asthma Only Group

BMI, body mass index; SEM, standard error of mean.
Values are mean±SEM or number of patients (%).
*n=67.
†n=134.
‡n=42.
§n=98.
∥n=22.
¶n=55.
**n=21.
††n=69.