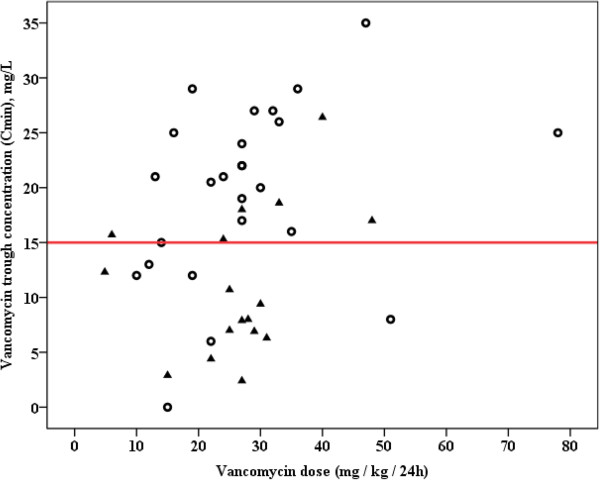
Figure 3.

Vancomycin trough concentration according to daily dose administered. *Red line indicates target trough concentration of 15 mg/L; circles represent patients with continuous infusion; triangles represent patients with intermittent dosing. Spearman rank correlation for (i) all patients: R = 0.540 (P <0.001), (ii) patients with continuous infusion: R = 0.587 (P = 0.062), and patients with intermittent dosing: R = 0.127 (P = 0.615).
