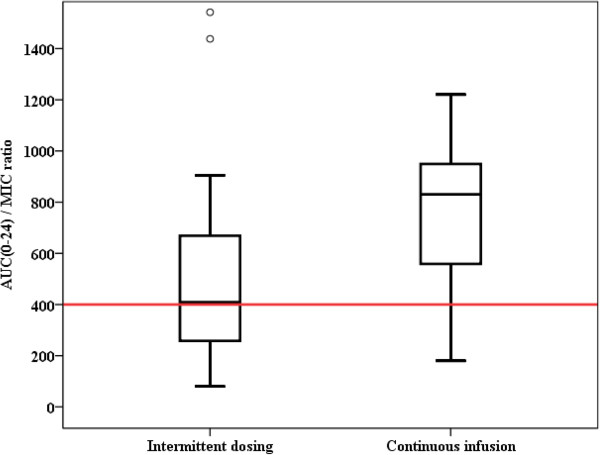
Figure 5.

AUC0–24/MIC ratios of vancomycin for intermittent dosing versus continuous infusion. *Boxes indicate lower quartile (bottom of box), median (band near the middle of the box), and upper quartile (top of the box); whiskers indicate the lowest value still within 1.5 of the interquartile range from the lower quartile, and the highest value still within 1.5 of the interquartile range from the upper quartile; circles indicate outliers. The red line indicates the minimum the target threshold for optimizing outcomes (AUC0–24/MIC >400). Difference between the groups: P = 0.029. AUC0–24/MIC, ratio of the area under the concentration-time curve over a 24-hour period divided by the minimum inhibitory concentration of the suspected bacteria.
