
Fig. 1. Functional signature-based ontology.
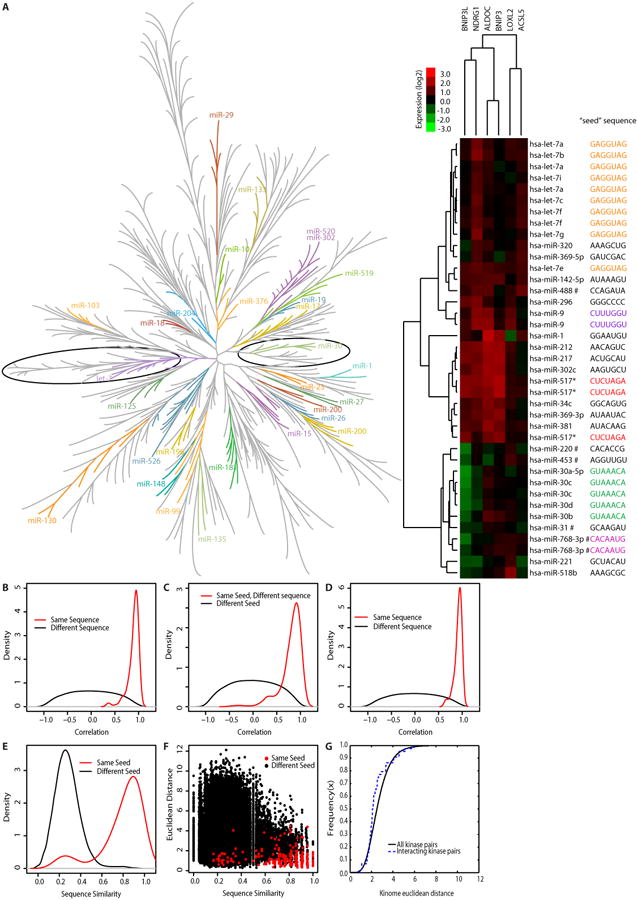
(A) Left: The neighbor-joining tree of the Euclidean distance among reporter gene signatures for all miRNA mimics. Co-clustering of seed-based miRNA families is indicated and color-coded. The let-7 and miR-30 branches are circled. (See table S1 for details.) Right: Unsupervised hierarchical clustering of expression data from miRNAs in these two branches. Identical seed sequences are indicated by color-coding. # indicates that the seed sequence shown and present in the miRNA library differs the annotated seed sequence in miRbase. (B) Density distributions (standard probability density plot) for redundant miRNA mimics (Same sequence, n = 105 pairs) and for nonredundant miRNA mimics (Different sequence, n = 90,420 pairs). (C) Density distributions for the non-redundant miRNA mimics that share an identical seed sequence (Same seed, Different sequence), n = 330 pairs) and for miRNA mimics with different seeds (Different seed, n = 90,090 pairs). (D) Density distributions of reporter gene signatures for miRNA mimic pairs with the same sequence or different sequence and that did not reduce the viability of HCT116 cells below 20% of the median (n = 405 miRNA mimics). (E) Overall sequence similarity was calculated between every miRNA mimic pair: non-redundant miRNA mimics sharing identical seed sequences, n = 330 pairs (red) and miRNA mimics with non-identical seeds, n = 90,090 pairs (black). (F) Euclidean distance between reporter gene signatures of each miRNA pair in the indicated categories is shown. To determine whether miRNA mimic pairs with identical seeds but dissimilar sequences outside the seed region produce expression signatures that are more highly correlated than those produced by miRNA pairs with similar overall sequence similarity but non-identical seeds, statistical analysis was performed on the subset of miRNA mimic pairs with sequence similarity <0.5. In (C-F), p < 2.2 × 10⁻¹⁶, Wilcoxon rank-sum test. (G) Cumulative distribution of Euclidean distances between all possible pairs of siRNAs targeting kinases (solid line) as compared to siRNA pairs targeting kinases known to physically interact (dotted line) (48). p = 0.0057, K-S statistic.