
Fig. 2. Mechanism of action annotation of kinases and miRNAs by FUSION.
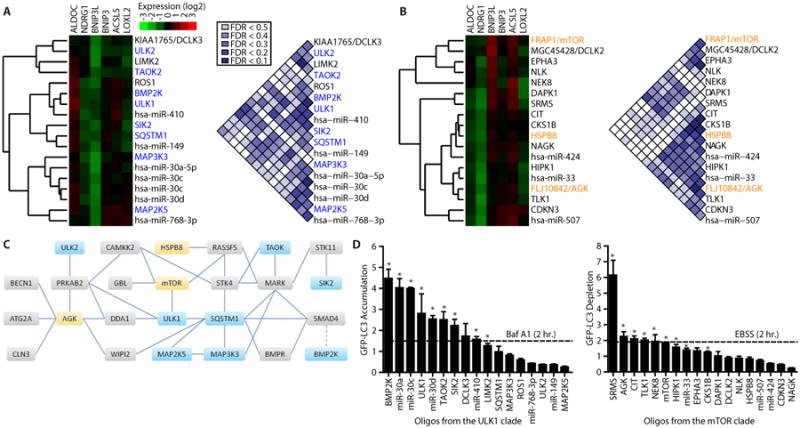
(A, B) The reporter gene signatures produced in HC116 cells by introduction of the siRNA or miRNA libraries were clustered with the complete-linkage method and the individual clades containing siRNAs targeting ULK1 (A) or mTOR (B) are presented as gene expression heat maps. FDRs are depicted for pairwise comparisons within each group. (C) A map of the autophagy regulatory network (23), including physical interactions (solid lines) and regulatory relationships (dotted line) among kinases in the ULK1 (blue) and mTOR groups (yellow) and between these kinases and other proteins (gray). (D) Quantification of GFP-LC3 by flow cytometry following siRNA pool or miRNA mimic introduction into U2OS cells. Median GFP fluorescence values were normalized to negative control oligonucleotides (LONRF1 for siRNAs or MC1 for miRNA mimics). n ≥ 3; mean + SEM. * indicates p < 0.05, one-tailed t-test. Baf A1, bafilomycin A; EBSS, Earle's Balanced Salt Solution nutrient deprivation media.