
Fig. 3. Validation of previously unknown modulators of autophagy.
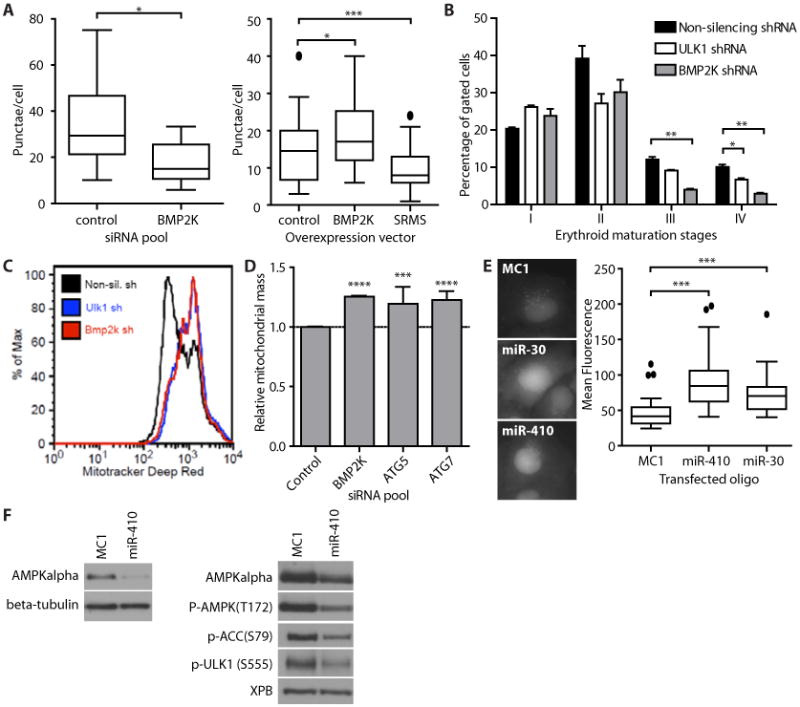
(A) Quantification of GFP-LC3 punctae in U2OS cells in which BMP2K was knocked down (left) or in which myc-tagged BMP2K, myc-SRMS, or the myc tag alone was overexpressed (right). n = 9-10 images (50-144 cells) per condition. Boxes represent median and quartiles, whiskers extend to 1.5 × the interquartile distance, and outliers are indicated by circles (left) or removed (right). GFP-LC3-positive punctae were counted in the transfected cells as identified by positive staining with an antibody that recognizes myc. LONRF1 served as the control siRNA and myc tag alone served as the overexpression control. *p < 0.05. unpaired t-test. Data are representative of three (left) and two (right) experiments. (B) Mouse erythroid progenitors with shRNAs targeting ULK1, BMP2K, or non-silencing control. Stages of differentiation were identified by flow cytometry for CD71 and Ter119: proerythroblast (I), basophilic erythroblast (II), late basophilic and chromatophilic erythroblasts (III), and orthochromatic erythroblasts (IV). Mean + SEM. n = 3 experiments. See fig. S5D for representative FACS plots. (C) Histograms of the fluorescence intensity of MitoTracker Deep Red FM used to reveal mitochondrial content of erythroid progenitor cells infected with the indicated shRNAs. Data are representative of three experiments (D) Quantification of flow cytometry of stable mito-mCherry in U2OS cells transfected with the indicated siRNAs. Mean + SEM, n = 3 experiments. ***p < 0.001.****p < 0.0001, unpaired t-test. (E) Representative images of GFP-LC3 in U2OS cells transfected with the indicated miRNA mimics (left). Image-based quantification GFP-LC3 in U2OS cells transfected with miRNAs (right). n = 36-46 cells per condition. Boxes represents median and quartiles, whiskers extend to 1.5 × the interquartile distance, and outliers are indicated by circles. ***p < 0.0001. unpaired t-test. (F) Western blot of HCT116 cells (left) or U2OS GFP-LC3 cells (right) transfected with miR-410 or negative control (MC1). Data are representative of five experiments.