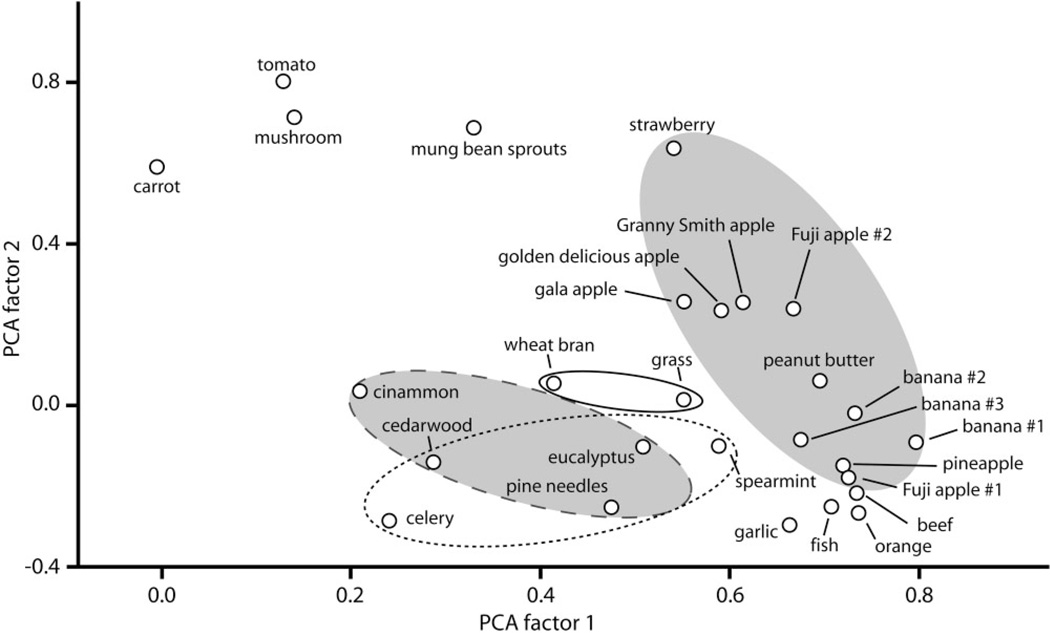
Figure 2.
Principal components analysis of 2-DG uptake patterns indicates clustering of odor objects belonging to similar general classes. Patterns evoked by all the objects of Figure 1 in addition to patterns evoked during replications of the banana exposure and exposures to different cultivars of apple (Supporting Figs. 1, 2) were compared pairwise using cell-by-cell Pearson correlations of uptake matrices. The resulting correlations matrix was used as input data for a principal components analysis and loadings on the first two extracted factors are displayed as a scatterplot to communicate more simply the multidimensional relationships that exist in the data. Each pattern is represented as a symbol, and symbols plotted nearer one another indicate more similar patterns. Ellipses enclose clusters of symbols involving related objects. The gray ellipse without border encloses noncitrus fruits. The gray ellipse with dashed border encloses objects derived from tree leaves or wood. The plain ellipse with solid border encloses two objects that are derived from grasses. The plain ellipse with dotted border indicates objects containing primarily terpene components.

