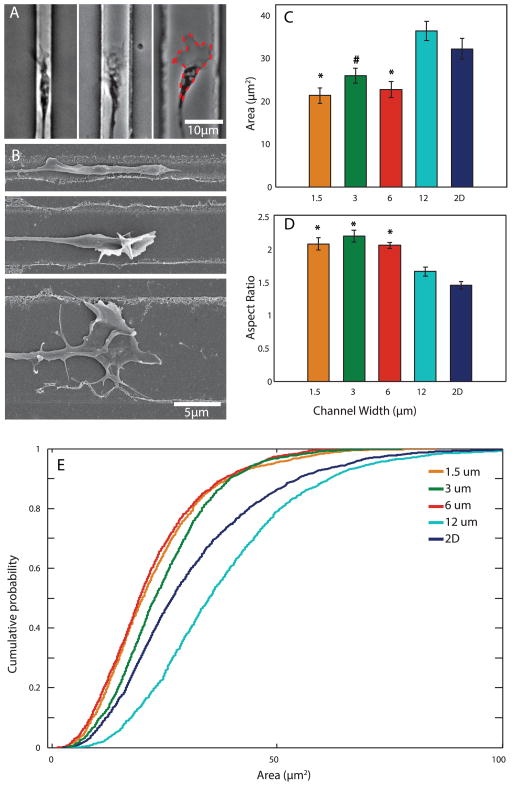
Figure 2.
Channel width controls growth cone morphology. (A) Left to right: representative brightfield images of growth cones in 1.5 μm, 6 μm, and 12 μm channels. Red dashed outline indicates typical area measurement. (B) Representative SEM images of growth cones in different channels. Top to bottom: 1.5 μm, 6 μm, 12 μm channels. (C, D) Average growth cone area and aspect ratio (major/minor axis) in each group. 2D indicates unpatterned substrate. N=19, 15, 22, 19, and 28 for 1.5 μm, 3 μm, 6 μm, 12 μm, and 2D, respectively. (E) Cumulative distribution histogram of individual growth cone area measurements. *p<0.05 when compared to 12 μm and 2D groups. #p<0.05 when compared to 2D group.

