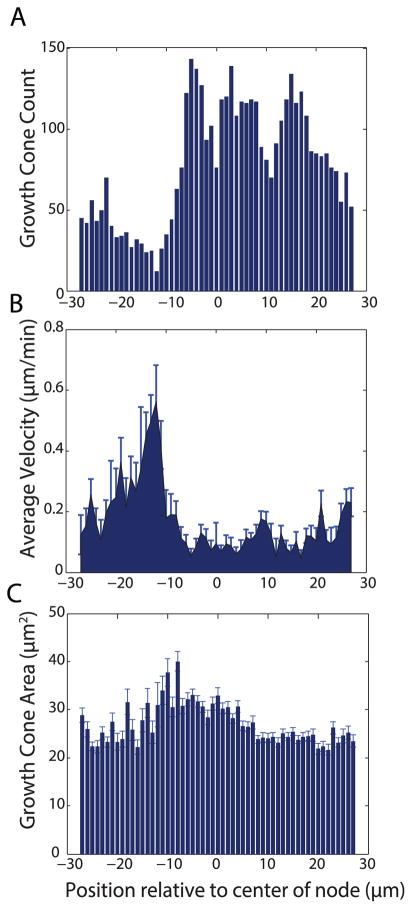
Figure 5.
Growth cones respond to local changes in channel width. (A) Histogram of total recorded growth cone locations in all timeframes and growth cones relative to center of node. (B) Average growth cone velocity at each location relative to center of node (B) Growth cone area averaged at each location measured from center of node. Node is located at −5 to +5 microns

