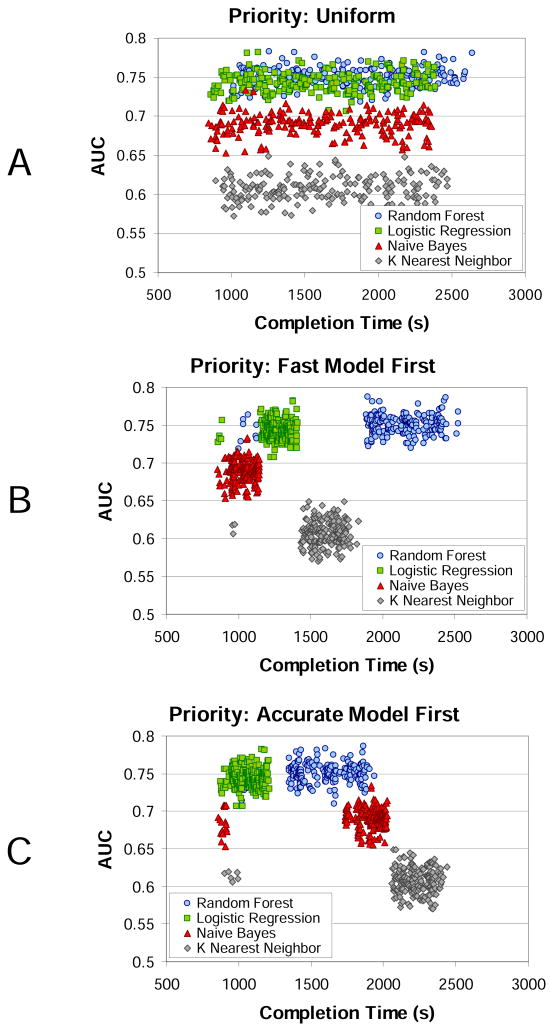
Figure 6.
Scatter plot of the AUC values for each classifier model (random forest, logistic regression, naive Bayes, k-nearest neighbor) as a function of completion time (in seconds) for the three different prioritization schemes: A) uniform, B) fast model first, and C) accurate model first for the Medium data set. The dependency graph was run on a Map-Reduce cluster with 80 concurrent tasks.

