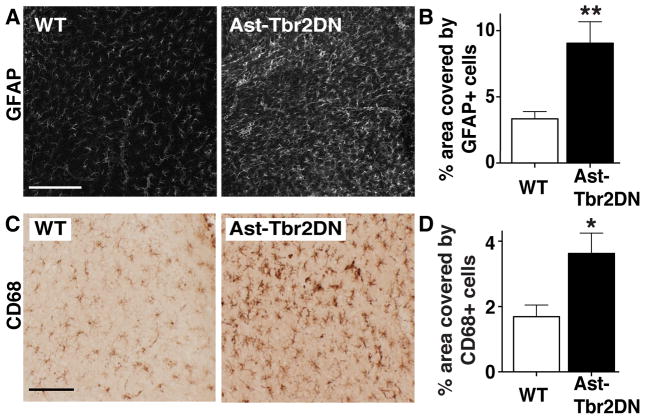
Figure 4. Lack of astrocytic TGFβ signaling increases the reactive astrogliosis and microglial/macrophage infiltration to acute Toxoplasma infection.
Brain sections from 2 wpi wildtype (WT) or Ast-Tbr2DN mice were stained as indicated and examined by light microscopy. For (B) and (D) quantification was done by stereology. A, B. Representative images (A) and quantification (B) of cortical area covered by GFAP+ reactive astrocytes in Ast-Tbr2DN and wildtype mice. C, D. Representative images (C) and quantification (D) of cortical area covered by CD68+ activated microglia and infiltrating macrophages in Ast-Tbr2DN and wildtype mice. Scale bar, 200 μm. N=7–9 mice per genotype, 2 images per mouse (B) and 5 images per mouse (D) 480 μm apart. Bars, mean ± SEM. *P<0.05, **P<0.01, Student’s t test.

