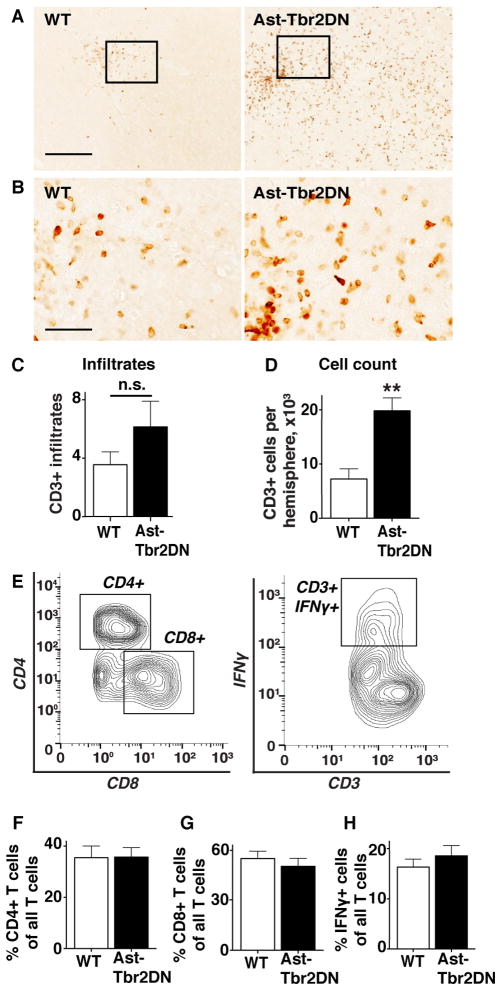
Figure 5. Lack of astrocytic TGFβ signaling exacerbates the T cell response to acute Toxoplasma infection.
Brain sections from 2 wpi wildtype (WT) or Ast-Tbr2DN mice were stained for CD3, examined by light microscopy and quantified using stereology. A. Representative images of CD3+ cells in the cortex of Ast-Tbr2DN and wildtype mice. Scale bar, 200 μm. B. Enlargement of boxed area of A. Scale bar, 50 μm. C. Numbers of discrete CD3+ cortical infiltrates in Ast-Tbr2DN and wildtype mice as quantified by 2 observers using light microscopy. N = 7–9 mice per genotype D. Stereology was used to quantify the total counts of CD3+ cells in cortex of Ast-Tbr2DN and wildtype mice. N=5 sections per mouse 480 μm apart, 7–9 mice per genotype. E–H. At 2 wpi, T cell lymphocytes were isolated from Ast-Tbr2DN and wildtype (WT) mice and analyzed by flow cytometery for the percentage of CD4+, CD8+ and CD3+IFNγ+ cells E. A representative analysis of the CD3+ cells isolated from the brain homogenate of a single mouse. F–H. Quantification of % CD3+ cell populations that are CD4+ (F) and CD8+ (G) in Ast-Tbr2DN and wildtype mice. H. Quantification of % CD3+ cell population that are IFNγ+ in Ast-Tbr2DN mice and wildtype controls. N=6 mice per genotype. Bars, mean ± SEM. **P<0.01, Student’s t test.

