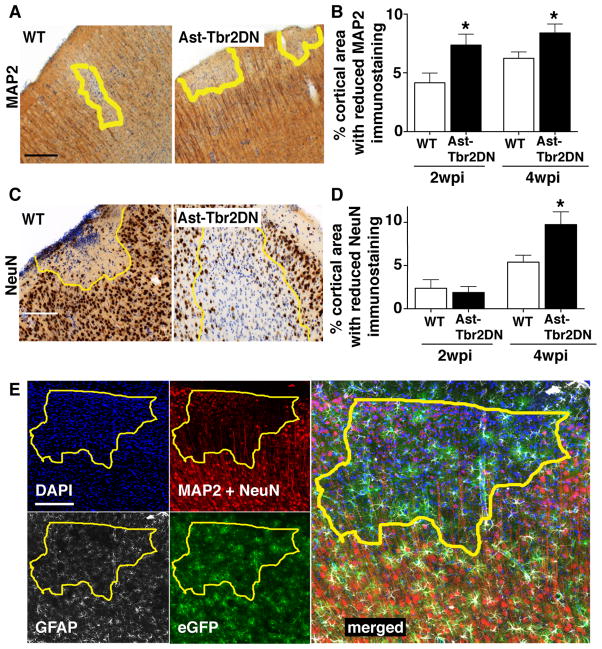
Figure 9. Inhibiting astrocytic TGFβ signaling increases neuronal damage during Toxoplasma infection.
2 and 4 wpi Ast-Tbr2DN and wildtype (WT) brain sections were stained as indicated and examined by light microscopy. A, C. Representative images of loss of MAP2 (A) or NeuN (C) staining in Ast-Tbr2DN or WT brain sections at 4 wpi. Yellow line represents area observed to have loss of stain. B., D. Quantification of the percentage of cortical areas denoted to have loss of MAP2 (B) or NeuN (D) staining in Ast-Tbr2DN or WT mice. E. Representative images of eGFP+/GFAP+ astrocytes in areas of neuronal damage in an Ast-Tbr2DN mouse 4wpi. Panels: DAPI-stained nuclei (upper left panel, blue), neuronal markers, which are composed of MAP2+ dendrites together with NeuN+ neuronal nuclei(upper right panel, red), GFAP+ astrocytes (lower left panel, white), eGFP+ transgenic astrocytes (lower right panel, green), and merge of all 4 channels (right panel). Yellow line represents area observed to have loss of neuronal marker immunostaining. Scale bars, 200 μm. N=5 images per mouse, 6 mice per genotype 2 wpi, 11–12 mice per genotype 4 wpi. Bars, mean ± SEM. *P<0.05, Student’s t test to compare with wildtype at same time point. In uninfected mice, there are no differences in gross neuroanatomical structures between Ast-Tbr2DN and wildtype littermates.

