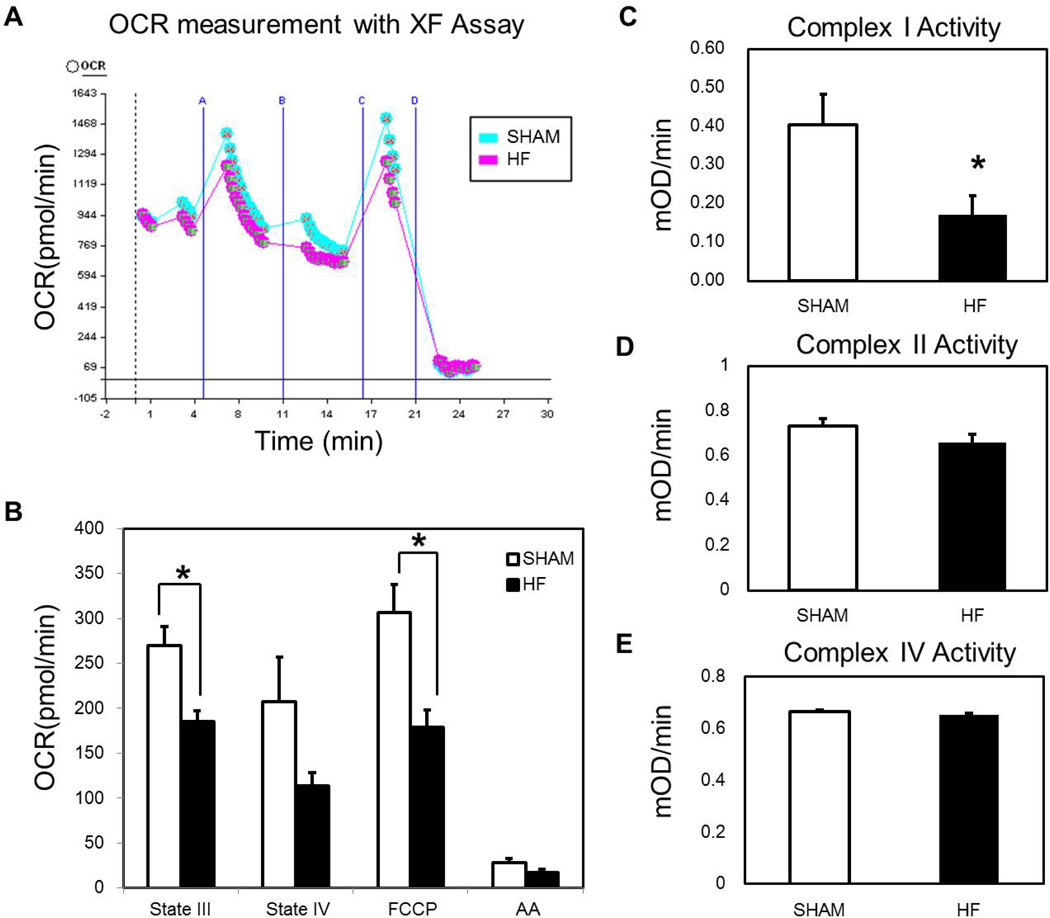
Figure 3.
Mitochondrial Function OCR (oxygen consumption rate) generated from Sham and HF mitochondria. A) Representative OCR curves generated with the Seahorse apparatus. B) Graph summarizes respiration states for HF and Sham mitochondria. Both ADP driven state III respiration and FCCP induced maximal respiration capacity were depressed in HF. N=10/group, *p < 0.05 vs. Sham. C) Complex I Activity - was decreased significantly in HF. D) Complex II activity did not differ between HF and Sham. E) Complex IV activity did not differ between HF and Sham. N=5/group for complex activity assays, *p < 0.05 vs. Sham.

