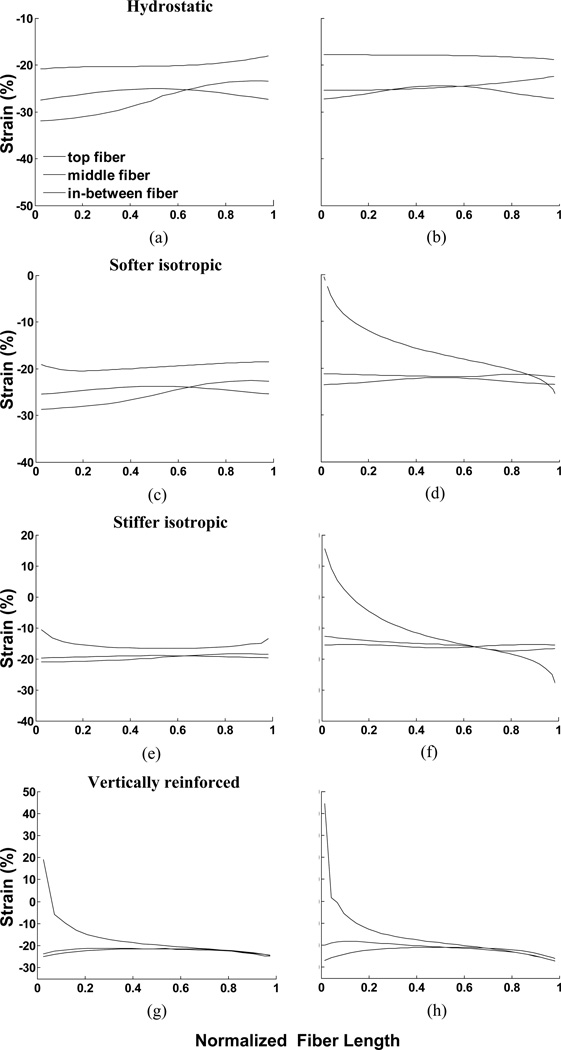
Fig. 7.
Strain along fibers in muscle for all 8 examples in response to maximal activation. The three lines represent fibers at the top end of the muscle, 25% of the distance along the muscle and in the mid-region of the muscle. The left column illustrates the 47° pennation angles and the right column, 25° pennation angles. (a) and (b) illustrate constant volume only (hydrostatic fluid), (c) and (d) illustrate softer material, (e) and (f) illustrate stiffer material, (g) and (h) illustrate vertically reinforced material. As the muscle is symmetrical, the curves for the fibers in the lower portion of the muscle would be left/right reversals of the plotted curves.

