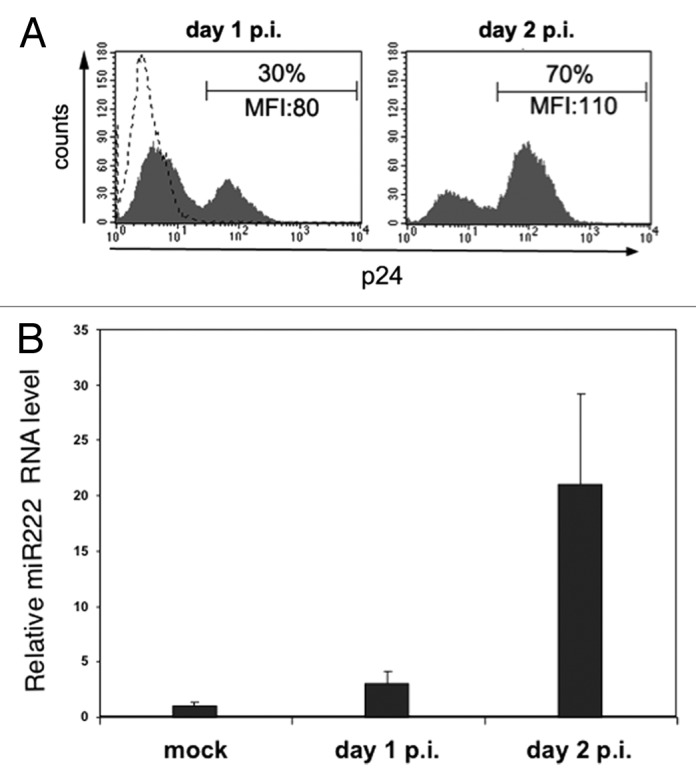
Figure 1. HIV-1 infection induces miR-222 expression. Jurkat cells were infected with HIV-1 by standard spin-infection method or not infected (mock) and analyzed at day 1 and 2 post-infection (p.i.) by flow cytometry (A) and qRT-PCR (B). (A) Histograms show the fluorescence of cells labeled with PE-conjugated anti-p24 mAb. The mean fluorescence intensity (MFI) values and the percentage of p24+ cells are indicated. Dashed line represents labeled mock-infected cells. (B) qRT-PCR was used to measure endogenous miR-222 expression level. Relative miR-222 level in mock Jurkat cells was set to 1. Error bars are SD of one experiment performed in triplicate. One representative experiment out of three is shown.
