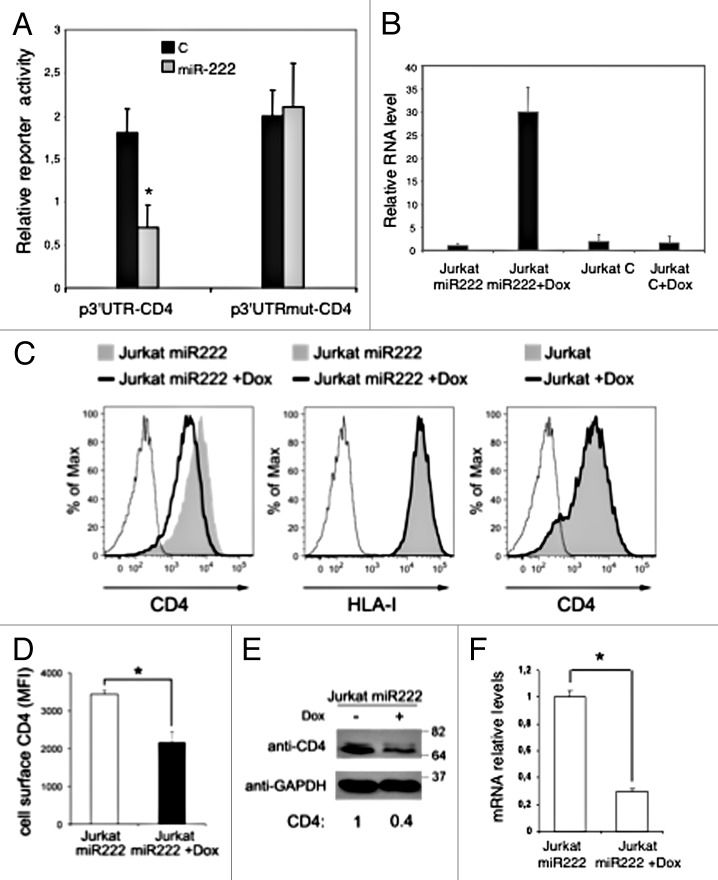
Figure 3. CD4 mRNA is a target of miR-222. (A) p3’UTR-CD4 or p3’UTRmut-CD4 luciferase constructs containing a wild-type (black columns) or a mutated (gray columns) CD4 3’UTR were co-transfected into HeLa cells with empty vector (C), or plasmid expressing miR-222 (p-222).8 Luciferase activity was determined 48 h after transfection. The ratio of normalized sensor to control luciferase activity is shown. Error bars represent SD and were obtained from three independent experiments. (B) Jurkat miR-222 and Jurkat C cells treated or not with DOX for 48 h, were analyzed by qRT-PCR to measure miR-222 expression level. Relative miR-222 level in Jurkat miR-222 cells not induced by DOX was set to 1. Error bars are SD of one experiment performed in triplicate. (C–F) Jurkat miR-222 cells treated as described in (B) were analyzed by flow cytometry (C and D), western blotting (E), and qRT-PCR (F). (C) Histograms show the fluorescence distribution of cells labeled with PE-conjugated anti-CD4 (left and right panels) or anti-HLA-I (middle panel) mAbs. Also, parental Jurkat cells with and without DOX were analyzed for cell-surface CD4 expression (right panel). Solid lines and filled gray histograms represent cells with and without DOX, respectively. Staining with control IgG is also shown (thin line). (D) The cell-surface CD4 MFI ± SEM obtained in three independent experiments like the one in panel (A) is shown. (E) Equal amounts of total cell lysates (20 μg) were separated by 10% SDS-PAGE followed by immunoblotting with anti-CD4 and anti-GAPDH antibodies. Molecular weight standards are indicated (kDa). The CD4 levels were measured by densitometry, normalized by GAPDH, and expressed by setting at 1 the value found in untreated Jurkat miR-222 cells. (F) qRT-PCR was used to assess CD4 mRNA expression. Relative mRNA level in untreated Jurkat miR-222 cells was set at 1. Error bars are SD of an experiment performed in triplicate. Results shown in panels (C–F) are representative of three independent experiments. *P < 0.05 by Student’s t test.

An official website of the United States government
Here's how you know
Official websites use .gov
A
.gov website belongs to an official
government organization in the United States.
Secure .gov websites use HTTPS
A lock (
) or https:// means you've safely
connected to the .gov website. Share sensitive
information only on official, secure websites.
