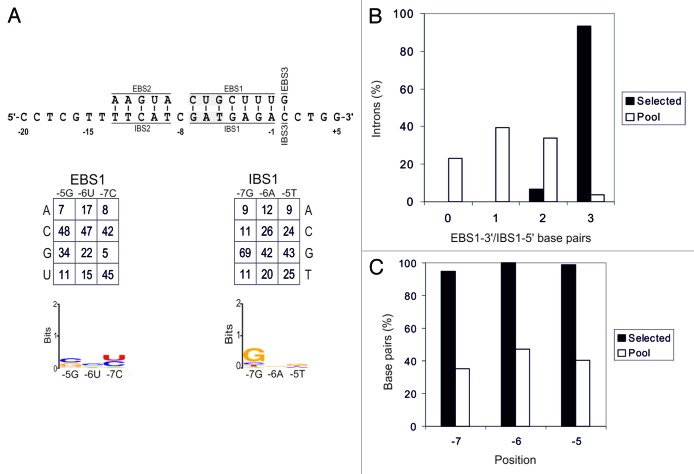
Figure 3. Analysis of EBS1-3′/IBS1-5′ interaction. Panel A shows EBS/IBS interaction (the randomized nucleotides are highlighted in gray), with the nucleotide frequencies obtained at each randomized position of intron-invaded plasmids, corrected for biases in the original pool, shown below. A WebLogo representation of corrected nucleotide frequencies at each randomized position of the selected target sites is also shown. (B) Percentage of introns with different numbers of EBS2/IBS2 base pairs formed with the target site in the selected invasion events (black bars) and randomly paired donor and recipient plasmids from the initial pools (white bars). (C) Percentage of base pairs at each EBS2/IBS2 position in the selected invasion events (black bars) and randomly paired donor and recipient plasmids from the initial pools (white bars).

An official website of the United States government
Here's how you know
Official websites use .gov
A
.gov website belongs to an official
government organization in the United States.
Secure .gov websites use HTTPS
A lock (
) or https:// means you've safely
connected to the .gov website. Share sensitive
information only on official, secure websites.
