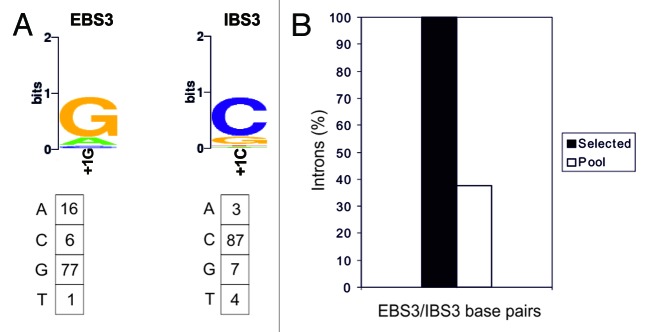
Figure 5. Analysis of EBS3/IBS3 interaction. (A) WebLogo representation of nucleotide frequencies in the integration events, corrected for biases in the initial pool. Nucleotide frequencies at the randomized position in the integration events corrected for biases in the initial pool are summarized below. (B) Percentage of intron base pairing at EBS3/IBS3 in the selected events and for randomly paired donor and recipient plasmids from the initial pools.
