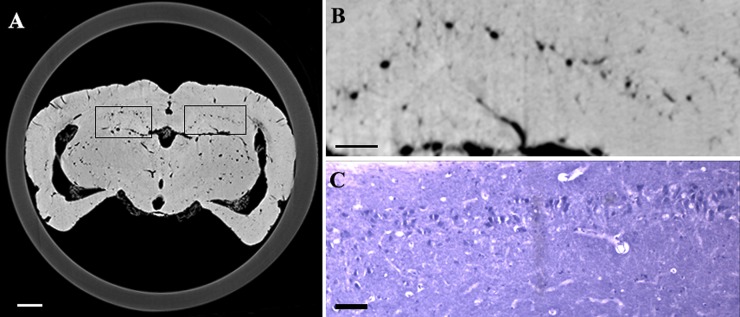
Figure 3.
Histomorphological observation and reconstruction of CT slices show the angioarchitecture of the rat brain. (a) A representative slice that was reconfigured using the in-line phase contrast imaging technique. (b) Partial enlargement of (a). Vascular distribution within the hippocampus was clearly visualized. (c) Microvessel distribution within a histological section of the hippocampus. Bar = 200 μm (in a, b) and 50 μm (in c).

