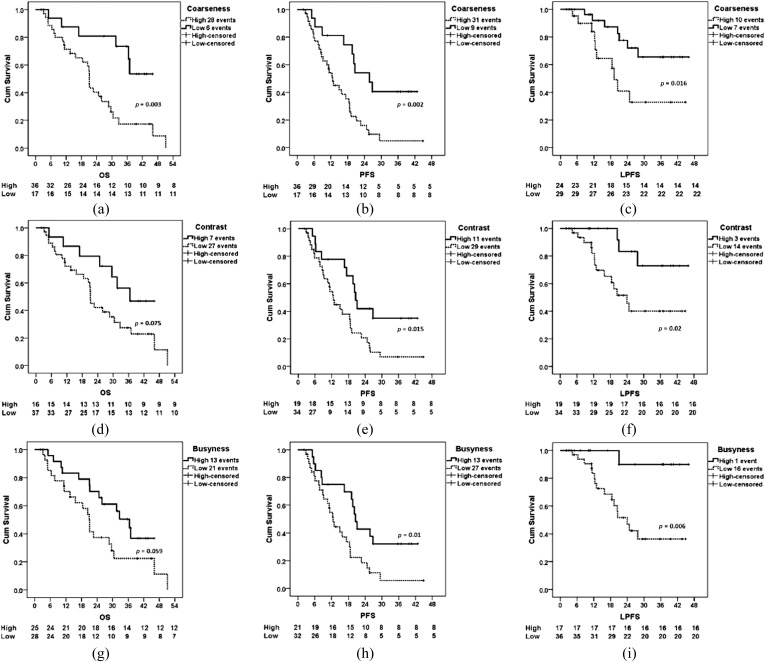
Figure 3.
Kaplan–Meier plots demonstrating differences in patients with high and low primary tumour 18F-fludeoxyglucose–positron emission tomography coarseness (a–c), contrast (d–f) and busyness (g–i). Differences in overall survival (OS) (a, d and g), progression-free survival (PFS) (b, e and h) and local progression-free survival (LPFS) (c, f and i) are demonstrated. Cum, cumulative. Reproduced from Cook et al25 with permission from SN Turiel & Associates, Inc. © by the Society of Nuclear Medicine and Molecular Imaging, Inc.

