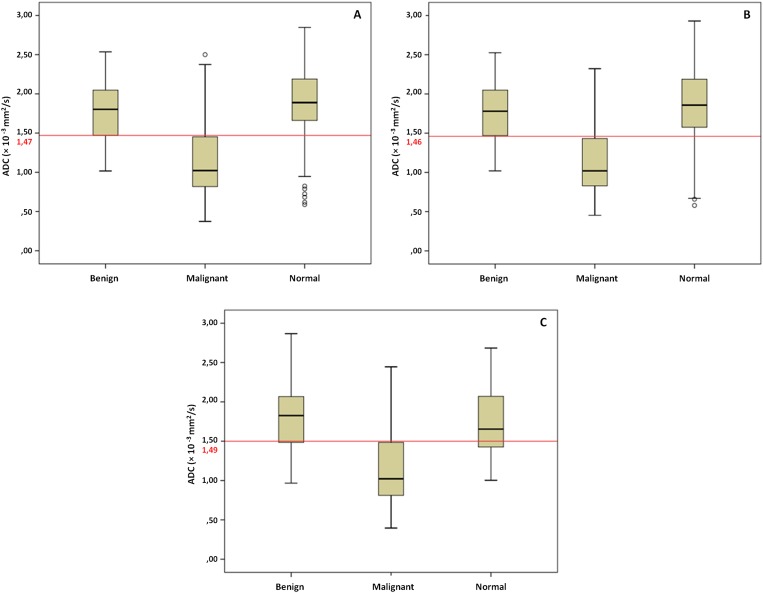
Figure 2.
Box plots for apparent diffusion coefficient (ADC) values (×10−3 mm2 s−1) for lesion type and normal glandular tissue for ADCall (a), 50, 1000 s mm−2 (b) and 200, 800 s mm−2 (c). The horizontal lines represent the corresponding ADC cut-off values for differentiating between benign and malignant lesions.

