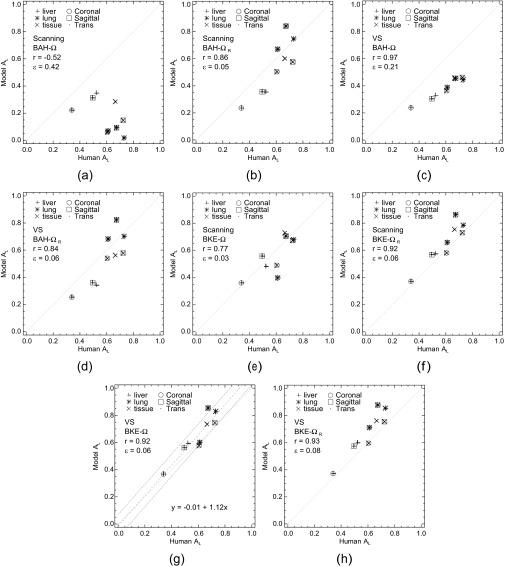
Figure 3.
(a–h) A comparison of human and model observer performances. Each plot compares the nine values of  from the human observers to the areas obtained from a model observer with one of the four tasks. The correlation coefficient (r) and root-mean-squared error (ε) are provided for each comparison. BAH, background-assumed-homogeneous; BKE, background-known-exactly; VS, visual search.

