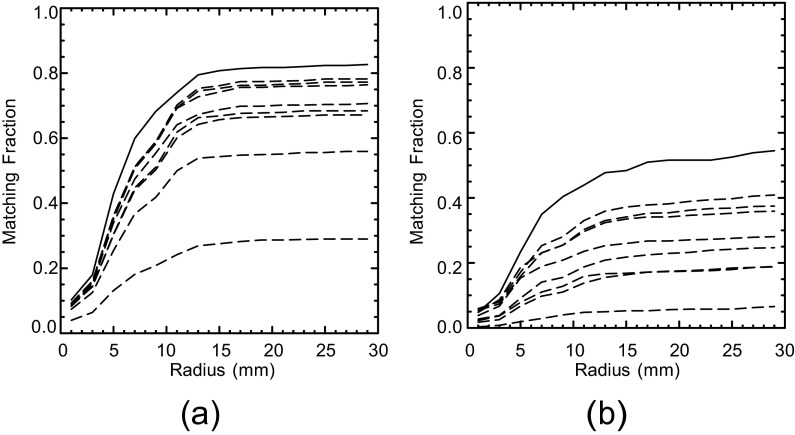
Figure 4.
Matching fractions for the human and model observers as a function of prospective threshold radius. Plot (a) is for the abnormal test images, and plot (b) is for the normal test images. Fm between the two human observers is indicated by the solid line in each plot. The other eight curves per plot indicate  for the model observers with the background-known-exactly and background-assumed-homogeneous tasks. Based on these plots, the threshold Rm was set to 15 mm.

