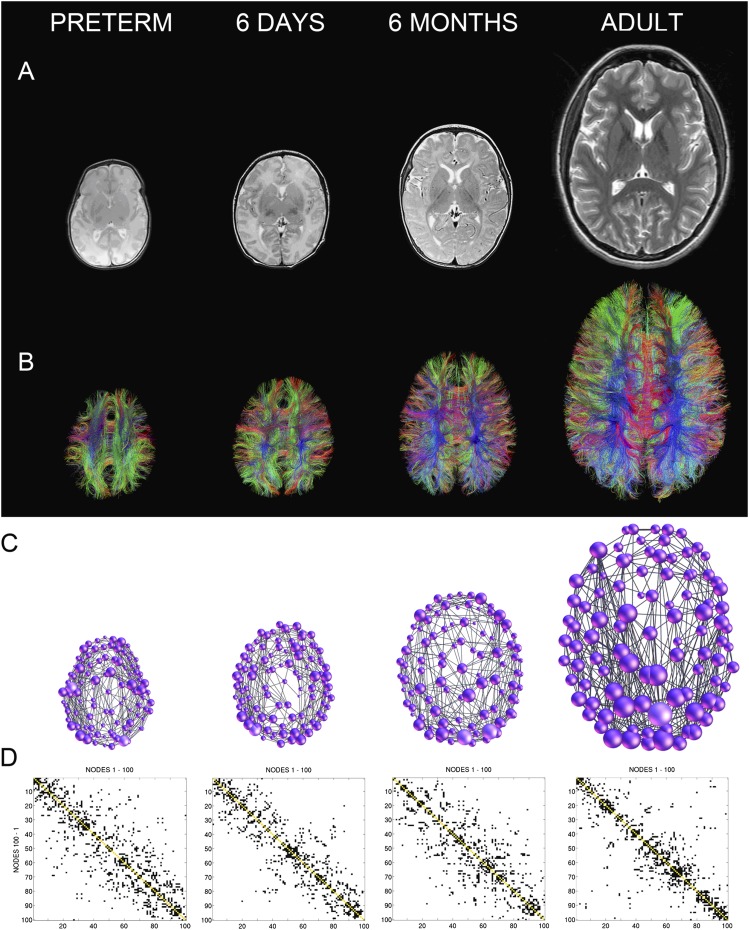
Figure 5.
Maturation of the structural connectome: examples of brain networks at four different ages. (a) Anatomic T2 weighted MRI images. (b) Tractograms reconstructed based on diffusion tensor imaging data. (c) Brain networks represented as graphs. The size of the nodes is proportional to the node degree. (d) Binary connectivity matrices, reordered in a way that maximizes the number of connections close to the main diagonal. Note: the 6 days and 6 months networks were mapped in the same infant longitudinally. Image modified from Tymofiyeva et al40 with permission from Public Library of Science.

