
Figure 3.
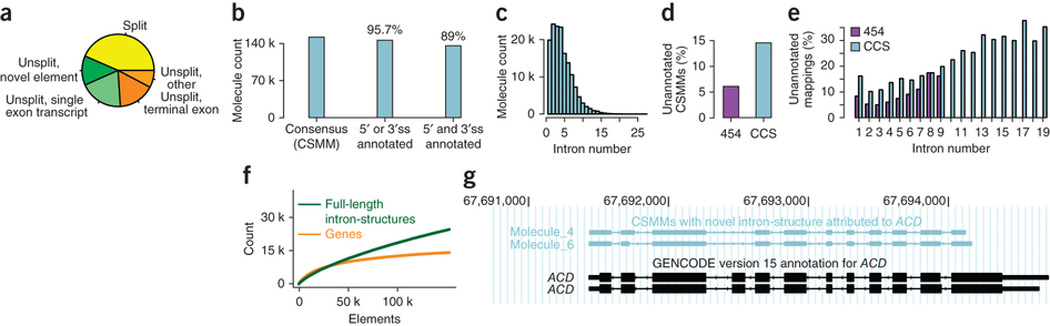
Exon-intron structure of molecules. (a) Pie-chart indicating the fraction of high confidence mappings that were: split into two or more segments (yellow); unsplit and overlapped no annotated element (darker green); unsplit with strong overlap with an annotated single-exon transcript (lighter green); unsplit with strong overlap of a terminal exon (darker orange); and unsplit overlapping other nonterminal exons (lighter orange). (b) Number of CSMMs having intron-consensus di-nucleotides at the ends of all splits (left), at least one split-end as an annotated splice site for all splits (middle) and only annotated splice sites (right). ss, splice sites. (c) Distribution of number of introns for CSMMs. (d) Percentage of unannotated CSMMs in 454 data14 and the CCS read data generated in this study. The observed difference is statistically significant (two-sided Fisher test, P < 2.2e-16). (e) Percentage of unannotated mappings for CSMMs with different numbers of introns for 454 and CCS read data. (f) Number of annotated genes (orange) and full-length isoforms (green), based on increasing numbers of CSMMs. (g) Example gene (ACD) with two unannotated isoforms shown by CSMMs. All CSMMs aligned to this gene are shown in Supplementary Figure 4.