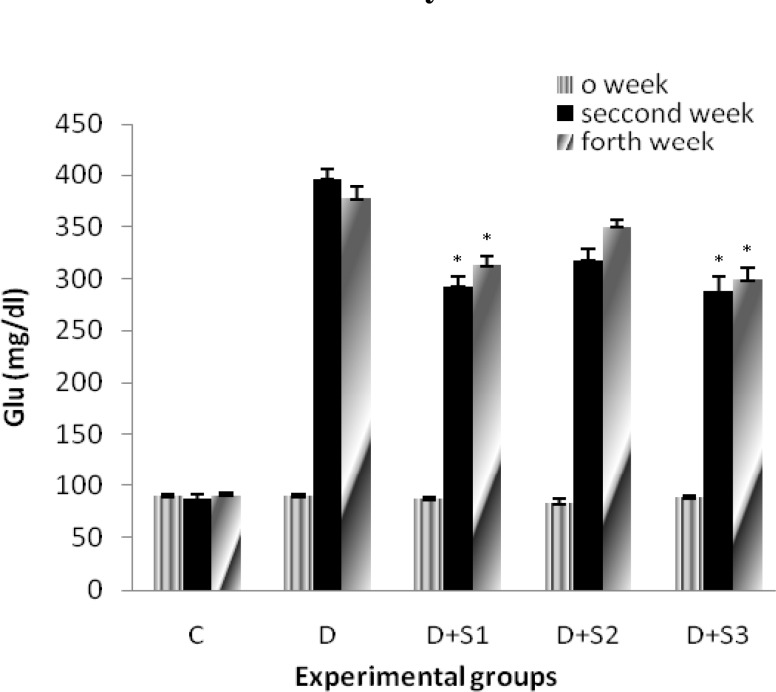
Figure 1.
Effect of hydroalcoholic extract of P. ferulacea on serum glucose levels in experimental groups on 0, 14, and 28 days. All values are expressed as Mean±SEM (n=8). Statistical comparisons between each group were carried out by one way ANOVA followed by Tukey´s multiple comparison tests.
* p<0.05 in comparison with diabetic values.
C: control group; D: diabetic group; D+S1: diabetic rats treated with hydroalcoholic extract of the roots of P. ferulacea (100 mg/kg); D+S2: diabetic rats treated with hydroalcoholic extract of the stems and leaves of P. ferulacea (100 mg/kg); D+S3: diabetic rats treated with insulin NPH (1 IU/kg).

