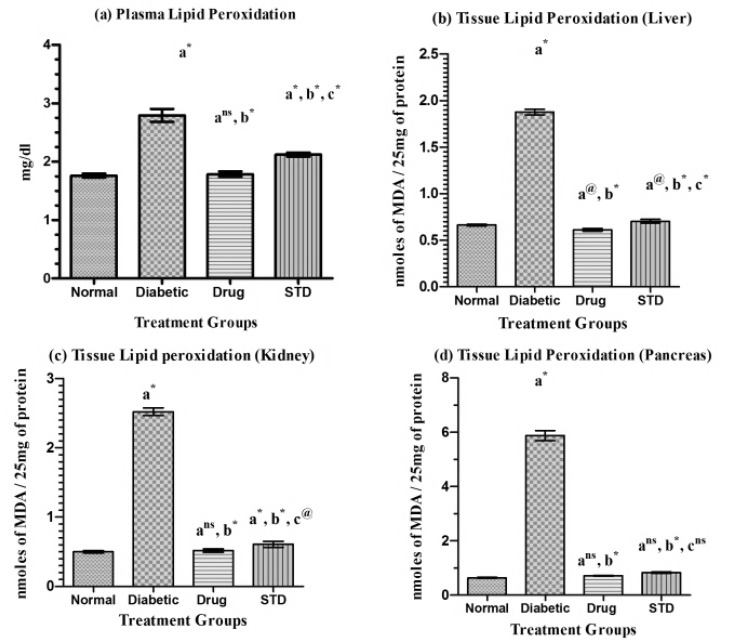
Figure 2.
Lipid peroxide activity of normal, diabetic, and diabetic rats treated with SETC after 30 days.
n = 6; p<0.05 is considered as statistically significant. Values are expressed as mean±S.E.M. using one-way ANOVA followed by Tukey’s multiple comparison method. Units are expressed as: Plasma Lipid Peroxides: mg/dl; Tissue Lipid Peroxides: nmoles of MDA liberated/min/mg protein.
a = normal control Vs diabetic control, test drug and standard. b = diabetic control Vs test drug and standard. c = test drug Vs standard. * = p<0.001; @ = p<0.01; # = p<0.05; ns = non significant.

