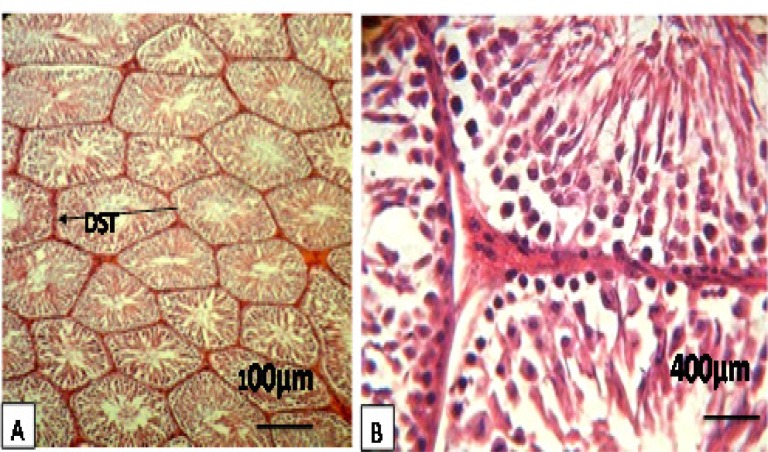
Figure. 1 A, B.
Rat testes after hematoxylin-eosin staining and ×100, ×400. Figures display representative images for a healthy control. It show images of the diameter of seminiferous tubules (DST), thickness of the epithelium, and spermiogenesis index (SPI). This observation indicates normal interstitial tissue, Sertoli cells, and thickness of the epithelium. Their seminiferous tubules showed all of the distinct developmental stages of spermatogenesis, including spermatozoa in the lumen of the tubules

