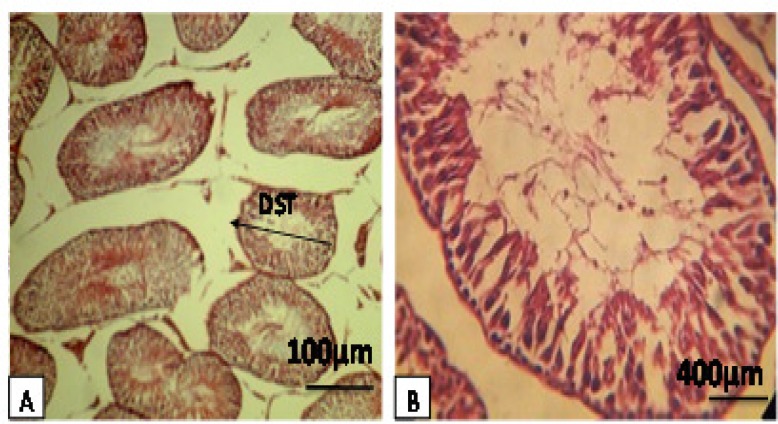
Figure 3A, B.
Rat testes after hematoxylin-eosin staining and 100×, 400×. Figures display representative images from a diabetic rat showing the diameter of seminiferous tubules (DST), thickness of the epithelium, and spermiogenesis index (SPI). This observation indicates a loss of interstitial tissue, Sertoli cells, developmental stages of spermatogenesis, and also reduction of sperm in the lumen and diameter of seminiferous tubules

