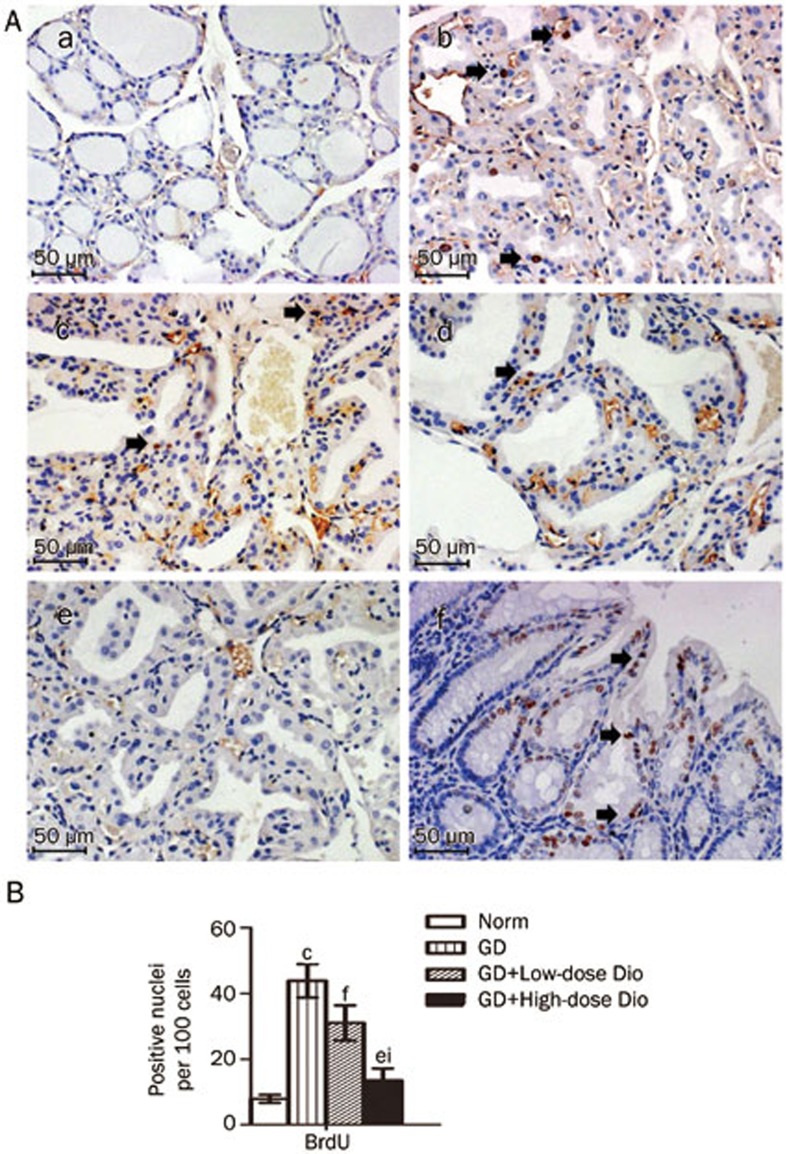
Figure 6.
Detection of proliferating thyrocytes labeled by BrdU after 24-d Dio treatment. (A) Representative images of BrdU detection (magnification, ×200). After BrdU incorporation in vivo, thyroid samples were obtained from the Norm (a), GD (b), GD+Low-dose Dio (c), GD+High-dose Dio (d) groups. The thyroid and small intestine tissues from the same mouse of (b) were used as the negative control (e) and positive control (f). BrdU-positive nuclei are noted by black arrows. (B) Quantitative analysis of BrdU detection. Data are expressed as mean±SD (n=5 per group). cP<0.01 vs the Norm group. eP<0.05, fP<0.01 vs the GD group. iP<0.01 vs the GD+Low-dose Dio group.

