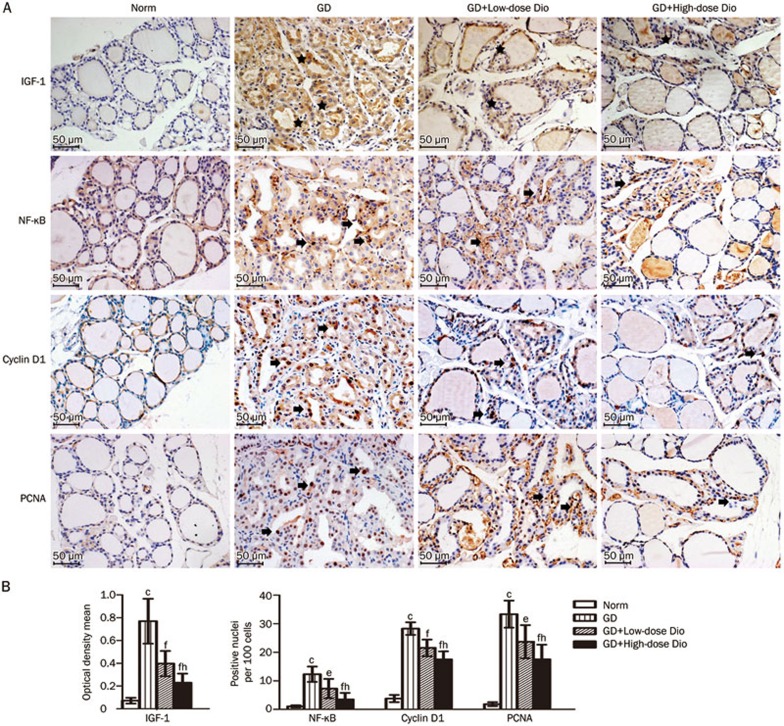
Figure 7.
Immunohistochemical staining of IGF-1, NF-κB, cyclin D1, and PCNA in thyroid after 24-d Dio treatment. (A) Representative images of immunohistochemical staining (magnification, ×200). Images of the negative control in the assay are not shown because they are similar to that in the BrdU detection above. Positive immunostaining is noted by black stars in the cytoplasm and by black arrows in the nucleus. (B) Quantitative analysis of immunohistochemical staining. Data are expressed as mean±SD (n=5 per group). cP<0.01 vs the Norm group. eP<0.05, fP<0.01 vs the GD group. hP<0.05 vs the GD+Low-dose Dio group.

