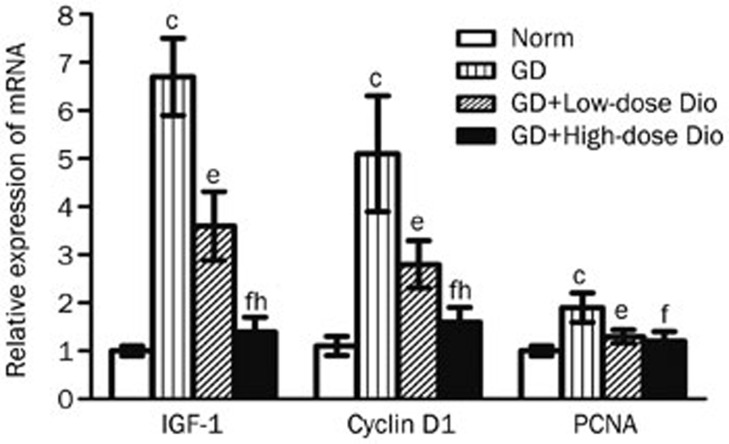
Figure 8.
Real-time PCR analysis of IGF-1, cyclin D1, and PCNA in thyroid after 24-d Dio treatment. β-Actin served as an internal standard. Relative expression was calculated as extent of change with respect to the normal control value. Data are expressed as mean±SD (n=5 per group). cP<0.01 vs the Norm group. eP<0.05, fP<0.01 vs the GD group. hP<0.05 vs the GD+Low-dose Dio group.

