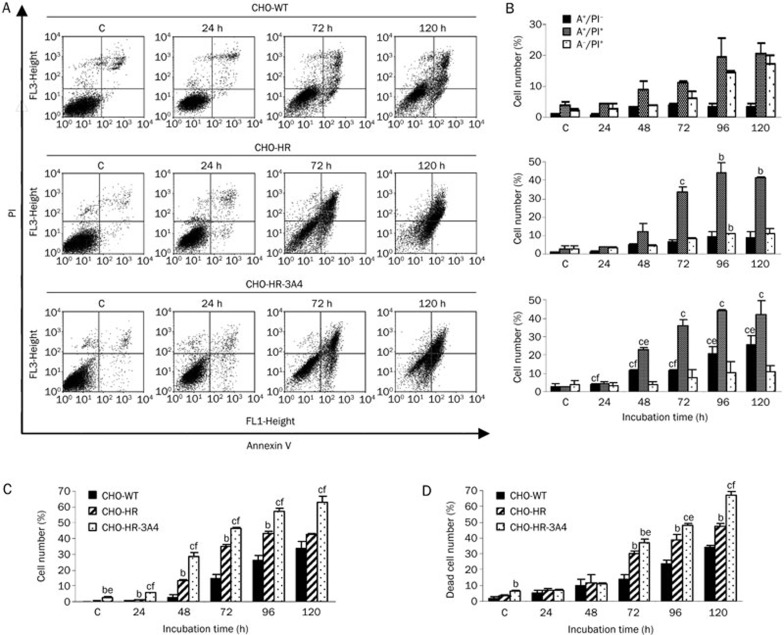
Figure 4.
Flow cytometry analysis of the membrane alteration and caspase-3 activity and quantification of dead cells in CHO cells treated with C-1311 at the IC80 concentration for the time indicated. (A) Representative bivariate flow cytometry histograms of the Annexin V signal versus the PI signal. The bottom left quadrant represents live unaffected cells (Annexin V−, PI−); the bottom right quadrant represents early apoptotic cells (Annexin V+, PI−); the top right quadrant represents late apoptotic and secondary necrotic cells (Annexin V+, PI+); and the top left quadrant represents primary necrotic cells (Annexin V−, PI+). (B) Percentages of early and late apoptotic and primary necrotic cells based on flow cytometry analysis. (C) Number of cells with active caspase-3 based on flow cytometry analysis. Values are the mean±SD. n=2 for CHO-WT and CHO-HR cells, n=3 for CHO-HR-3A4 cells. (D) Population of dead cells quantified under fluorescence microscope after double staining with fluorescein diacetate (FDA) and propidium iodide (PI). Cells that hydrolyzed FDA to its green fluorescent derivative were counted as live cells, whereas red cells stained only with PI were considered dead. Values are the mean±SD. n=2. bP<0.05, cP<0.01 vs CHO-WT cells. eP<0.05, fP<0.01 vs CHO-HR cells, Student's t-test.

