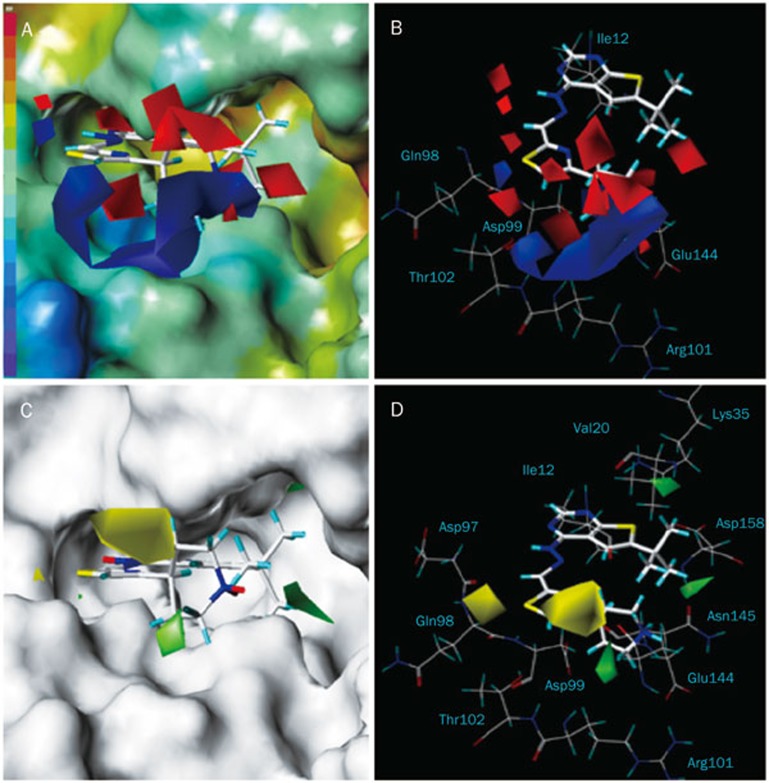
Figure 4.
3D-QSAR electrostatic contours plots projected onto the MOLCAD electrostatic potential surface of the CDK4 active binding site for compound 47 (A). Comparison between the electrostatic contours and the active site residues (B). Steric contour plots projected onto the MOLCAD solvent accessible surface map (C). Comparison between the steric contours and the active site residues (D).

