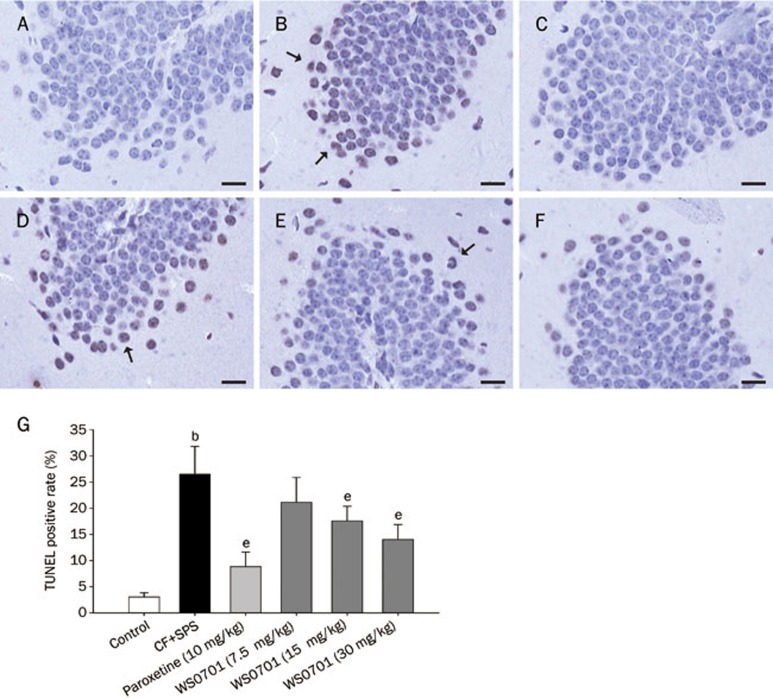
Figure 7.
Representative TUNEL staining pictures from hippocampal dentate gyrus sections. The arrows indicate apoptotic neurons. The values are expressed as the mean±SD. bP<0.05 compared to the control group. eP<0.05 compared to the CF+SPS group. (A) Control group, (B) CF+SPS group, (C) Paroxetine 10 mg/kg group, (D) WS0701 7.5 mg/kg group, (E) WS0701 15 mg/kg group, (F) WS0701 30 mg/kg group, and (G) the TUNEL-positive cell rates for each group. Scale bar=10 μm, n=3.

