
Figure 5.
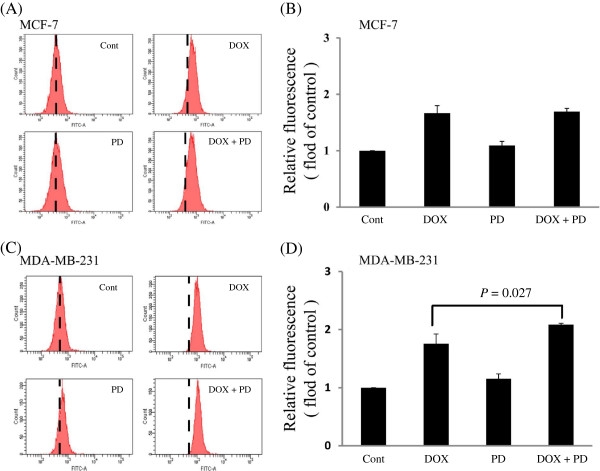
Intracellular DOX accumulation in breast cancer cells. Cells were pretreated with 5 μM DOX, 10 μM PD, or 5 μM DOX + 10 μM PD for 1 h. Then, the cells were washed, harvested, and re-suspended in PBS. Intracellular fluorescence was measured by flow cytometry analysis. The fluorescence intensity indicates the intracellular DOX concentration. (A) Flow cytometry assay images of MCF-7 cells; (B) statistical results of three independent tests of A; (C) flow cytometry assay images of MDA-MB-231 cells; and (D) statistical results of three independent tests of C. Values were expressed as mean ± SD of three independent assays. Statistical analysis was performed with one-way ANOVA and Tukey’s test.