
Extended Data Figure 6. Effect of JQ1 on the TMPRSS2-ERG loci and ERG-mediated transcription in VCaP cells.
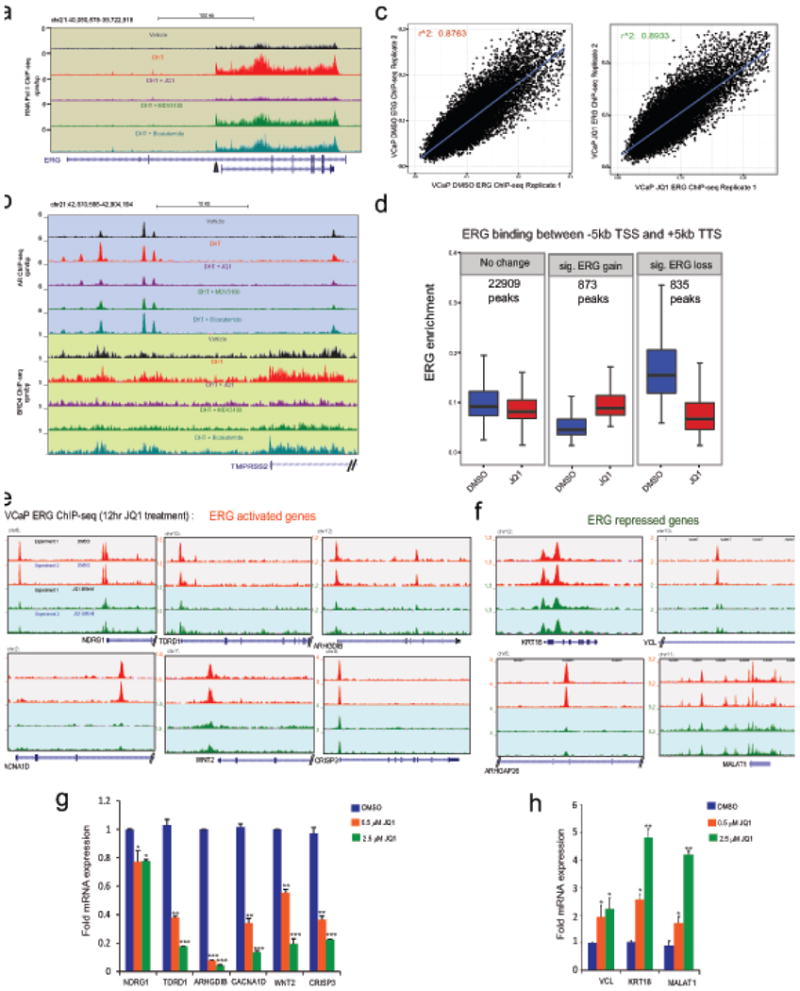
a, Genome browser representation of RNA PolII binding events within the ERG gene body. The y-axis denotes reads per million mapped reads per base pair (rpm/bp), the x-axis denotes the genomic position and the black arrow indicates the region involved in TMPRSS2-ERG fusion. b, as in a, AR and BRD4 binding on promoter of ERG 5′-fusion partner TMPRSS2 in VCaP cells. Note the reduced RNA PolII and AR/BRD4 recruitment levels in DHT+JQ1 tracks for ERG gene body and TMPRSS2 promoter respectively. c, High reproducibility of ERG ChIP-seq experiments. Biological replicates of ERG ChIP-seq experiments show very high correlation of normalized enrichment levels (see Methods) in the JQ1- and DMSO-treated conditions. d, Significant changes in ERG levels upon JQ1 treatment at ERG-binding sites in the proximity of gene loci. Changes in ERG enrichment levels were assessed using DESeq2. Statistically significant differences were observed for ERG-gain and ERG-loss. Significant ERG-gains are associated with quantitatively modest changes in enrichment level. On the other hand significant ERG-losses are associated with greater changes in enrichment levels. Individual number of peaks for each panel is shown. e, Genome browser representation of ERG binding events on bona fide ERG-activating target genes. The y-axis denotes reads per million per base pair (rpm/bp), the x-axis denotes the genomic position. f, Genome browser representation of ERG binding events on ERG-repressed target genes. g, TaqMan QRT-PCR analysis of ERG-activated genes in VCaP cells after JQ1 treatment. h, TaqMan QRT-PCR analysis of ERG-repressed genes in VCaP cells after JQ1 treatment. Data represents mean ±S.D. (n= 3) from one of the two independent experiments.*P ≤ 0.05; **P ≤ 0.005,***P ≤ 0.0005 by two-tailed Student's t-test.